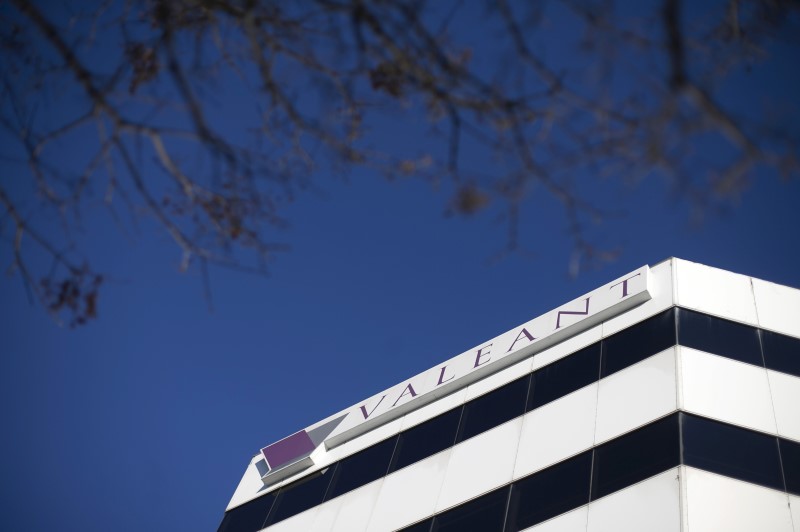
(Adds portfolio manager quotes and updates prices)
* TSX closes up 37.33 points, or 0.24 percent, at 15,426.28
* Valeant shares jump 7.5 percent on asset sales
* Six of the TSX's 10 main groups move higher
By Fergal Smith
TORONTO, Jan 10 (Reuters) - Canada's benchmark stock index rose on Tuesday, led by the financial and materials groups as metal prices rose, while shares of drugmaker Valeant Pharmaceuticals International Inc (NYSE:VRX) VRX.TO surged as it sold assets.
The Toronto Stock Exchange's S&P/TSX composite index .GSPTSE closed up 37.33 points, or 0.24 percent, at 15,426.28.
"On a flat day financials always seem to catch a little bit of a bid and then you've got the strength in the base metals contributing to the index move along with Valeant," said Matt Skipp, president of SW8 Asset Management.
Shares in Valeant rose 7.5 percent to C$21.82 after the drugmaker said it is selling its Dendreon cancer business and three skincare brands for about $2.12 billion as it looks to pay down its more than $30 billion debt. a pullback in oil prices has weighed on the TSX since it reached 15,621.40 on Thursday, its highest since September 2014.
Investors have also been fretting that U.S. President-elect Donald Trump could shake markets at a news conference on Wednesday by taking an aggressive line on issues such as trade policy and relations with China. would say that the market has been pretty optimistic about what Trump wants to do and somewhat in denial about the risk in implementing some of the things that he wants to do," Skipp said.
Financials rose 0.4 percent, helped by gains for some of the country's major banks. Bank of Nova Scotia BNS.TO rose 0.8 percent to C$76.96, while U.S. bank stocks climbed in advance of earnings season. materials group, which includes precious and base metals miners and fertilizer companies, added 1.6 percent as copper prices CMCU3 jumped 3 percent. Gold XAU= and silver XAG= also gained. MET/L GOL/
Among the most influential movers on the index were First Quantum Minerals Ltd FM.TO , which rose 10.1 percent to C$15.87, and Teck Resources Ltd TECKb.TO , which added 7.8 percent to C$29.63.
Gildan Activewear GIL.TO shares gained 1.5 percent to C$33.94 after it said it won a bankruptcy auction to buy U.S. fashion retailer American Apparel for about $88 million in cash. of the index's ten main groups ended lower, with energy declining 0.9 percent as oil fell.
U.S. crude oil futures CLc1 settled $1.14 lower at $50.82 a barrel, pressured by uncertainty over implementation of a global deal to cut output. O/R
Department store operator Hudson's Bay Co HBC.TO fell 12.9 percent to C$10.16 after it cut its full-year revenue forecast.
