- All Instrument Types
- Indices
- Equities
- ETFs
- Funds
- Commodities
- Currencies
- Crypto
- Bonds
- Certificates
Please try another search

Chart Of The Day: Time To Short The Dollar, Again?

Forex traders might be confused right now. Despite all the recent talk about a dollar bottom, today the dollar fell for a fourth straight day.
The dollar is following “sagging US yields sap[ping] momentum,” according to a Reuters article. The only problem with this claim is that as of the time of writing, the heavily watched 10-year yield is up one basis-point to 2.8, but the dollar is still 0.15 percent down, at the bottom of the session.
Perhaps dollar traders are still scaling back expectations on the number of hikes this year after the weaker than expected CPI release last Thursday. We, however, forecast that 10-year yields would decisively break the 3.00 psychological barrier after completing a bullish falling flag.

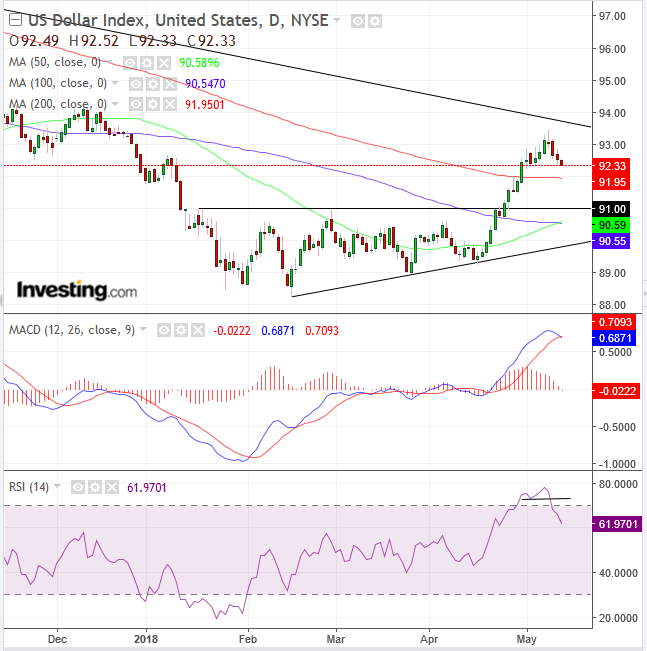
Still, the Dollar Index is falling after nearing its downtrend line since President Donald Trump killed the dollar in mid-January 2017 when he complained to the Wall Street Journal that the too strong a dollar is “killing us.” On the positive side, the price crossed above the 200 DMA (red) on March 30, which was followed by the 50 DMA (green) crossing above the 100 DMA (blue), demonstrating that price momentum is improving. On the other hand, the MACD’s shorter MA just crossed below its longer MA, showing the reverse, while the RSI double-topped, suggesting prices would follow the more recent momentum lower.
After having been dollar-bearish for most of last year, we have started reiterating bullish forecasts for the dollar in the last month. The greenback completed an ascending triangle, implying a move toward 93.70.
Last Tuesday’s high wave candle with a high price of 93.42 came close enough, and the proximity of the imposing downtrend that started the dollar’s falling out of the Trump Trade may be ominous enough to scare bulls away and re-invigorate bears.

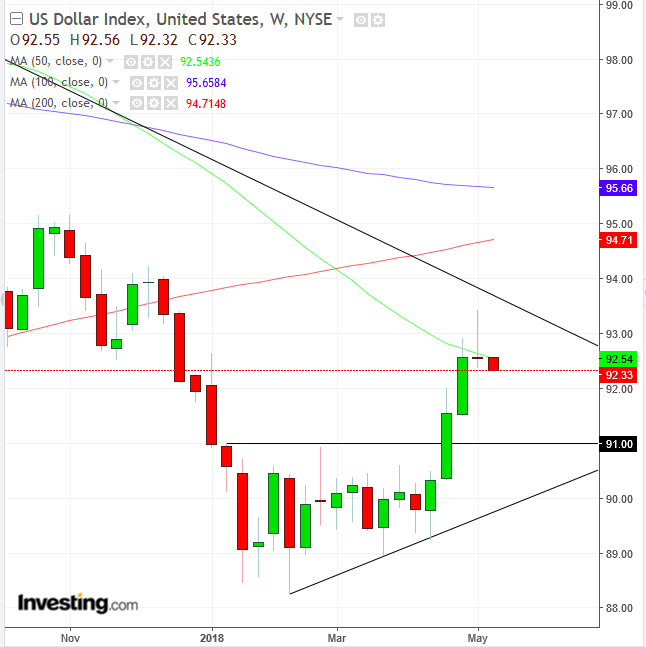
Finally, the weekly chart offsets the bullish signals on the daily chart in the longer term. Here we can see that last week’s failure to keep gains formed a Gravestone Doji—which occurs when the open, low and close are all at the low of the day—beneath the resistance of the infamous downtrend line, guarded by the 200 Week Moving Average (WMA).
At the the same time, the price fell back below the 50 WMA (green) after the shorter MA crossed below the 200 WMA (red) early March, executing a Death Cross. With names like Gravestone Doji and Death Cross, it’s a sure bet that sentiment would be bearish.
Trading Strategies – Short Position Setup
Conservative traders would wait for a new trough below the February low is posted in order to reaffirm the continued downtrend.
Moderate traders would be happy with a second failed attempt by bulls to seal the deal for a bearish outlook.
Aggressive traders may short now, providing their trading strategy could afford the stop-loss above 93.50, the presumed correction peak posted last Tuesday, or else they risk losing the position.
Equity Management
- Entry: 93.00
- Stop-Loss: 93.50
- Risk: 0.50
- Target: 91.00
- Reward: 200
- Risk-Reward Ratio: 1:4
Related Articles

CAD While the loonie has not fully unwound the recent move lower on the back of Trump’s comments yesterday, it is notable that USDCAD has begun early trading this morning with a...

Welcome to Simply Forex This content was originally published by our partners at Simply Forex.

FX volatility levels remain close to two-month lows as investors weigh up dominant themes. The possibility of a ceasefire in Ukraine certainly plays a role, judging by the pricing...
Are you sure you want to block %USER_NAME%?
By doing so, you and %USER_NAME% will not be able to see any of each other's Investing.com's posts.
%USER_NAME% was successfully added to your Block List
Since you’ve just unblocked this person, you must wait 48 hours before renewing the block.
I feel that this comment is:
Thank You!
Your report has been sent to our moderators for review


Add a Comment
We encourage you to use comments to engage with users, share your perspective and ask questions of authors and each other. However, in order to maintain the high level of discourse we’ve all come to value and expect, please keep the following criteria in mind:
Perpetrators of spam or abuse will be deleted from the site and prohibited from future registration at Investing.com’s discretion.