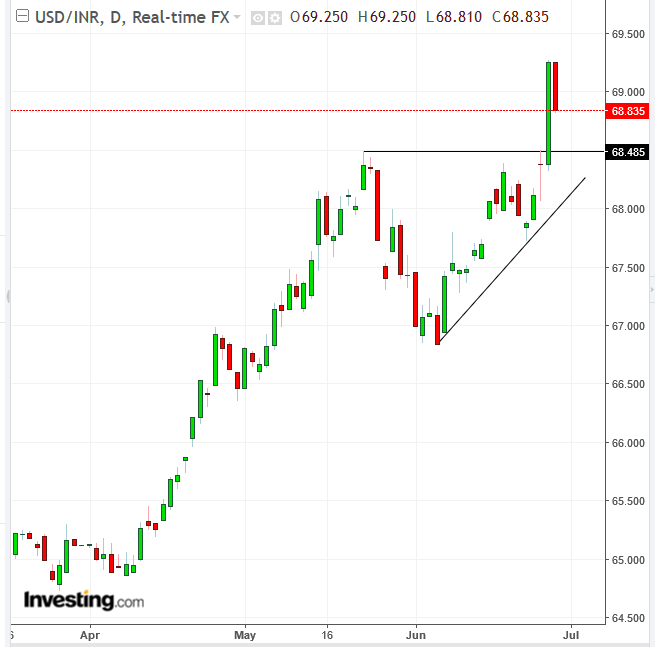
The Indian rupee took a dive yesterday, down 0.7% to 69.0925 against the dollar, to a record low, passing its previous record of 68.8650 posted during November 2016. The currency's slump can be blamed on two catalysts: the US dollar and the price of oil.
The stronger dollar, which is now at its highest level for the year, has been driving investors out of all emerging markets. But as the world's third largest oil consumer, India has been particularly hard hit because oil prices—currently at a three-and-half year high—are denominated in USD. With two-thirds of India's oil supply coming from imports, the rupee is particularly sensitive to both the stronger greenback and the higher price of oil since rising oil prices mean India must sell more rupees to buy the stronger dollar, with which to pay for their oil.
Thus the Indian currency is at the mercy of a double whammy that's now working in tandem to continually devalue the rupee. This also has broader and potentially more severe ramifications for an economy that's so reliant on foreign oil.
For every $10 move higher in price, the cost of oil worsens India's current account balance by 0.4 percent of the gross domestic product, and pushes up inflation by 30-40 basis points, according to analysts at Nomura Holdings.
This creates a vicious cycle for the Indian money:
- The growing account deficit increases analysts' bearish stance
- The negative outlook exacerbates capital outflow, which increases the current account deficit
The outflow of funds, in turn, further pressures the rupee, which inflates the account deficit, driving additional bearish sentiment about the country’s economy. Analysts at Barclays now predict the currency will slip to 72 rupee to teh dollar by year-end, while DBS Bank sees it at 71 to the dollar by June 2019.

Yesterday’s USD/INR jump provided an upside breakout to an ascending triangle, a pattern that develops when demand outpaces supply. The breakout demonstrates that buyers absorbed all available supply of the global reserve currency at the current levels and are willing to bid prices higher to find willing sellers.
This dynamic suggests that momentum is on the side of demand and will continue to be so with a minimum target of 70.00—based on the height of the pattern—almost another percent higher, or more than a percent higher, if traders wait for a return move toward the pattern. If Barclays' target of 72.00 is correct, the key-level break may spur speculation higher.
Trading Strategies
Conservative traders would wait for a return move—after the breakout, which may extend higher—to verify the pattern’s integrity, with at least one long green candle engulfing a preceding red or small candle of any color.
Moderate traders may wait for the potential return move for a better price entry though not necessarily for verification of the trend.
Aggressive traders may enter a long position now, provided they can either afford a stop-loss below the 68.45 pattern top or the potential loss to their account.
Equity Management
Whatever your risk level, enter a trade only after establishing a plan that offers you a minimum of 1:3 percent risk-reward ratio.
Trade Example:
- Entry: 68.50
- Stop-loss: 68, Risk: 50
- Target: 70, Reward: 150, Risk-Reward Ratio: 1:3
