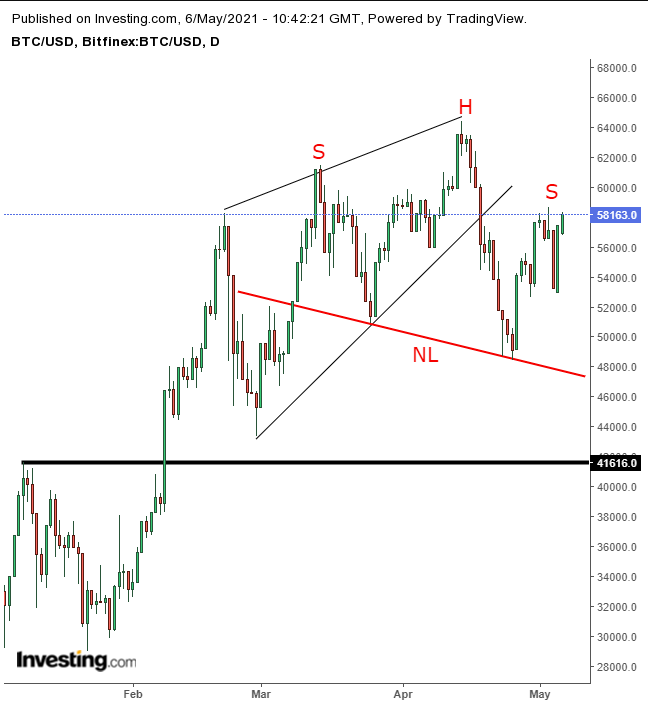
The last time we wrote about Bitcoin in this column, at the end of March, we were bullish on the cryptocurrency's trajectory. Sure enough, since then, the price climbed, gaining almost an additional $8,000, or 14%. However, our outlook has now changed.
Yes, we know that crypto custody firm NYDIG just said, “Bitcoin is coming to hundreds of US banks this year." But then they would say that—their business is dedicated to Bitcoin. We're also familiar with the repeated claim that the cryptocurrency leader by market cap should hit “$1 million a coin,” but the caveat attached to that is always "eventually."
In February, even before the token hit an all-time high, shooting past $63K in mid-April, we made the counterintuitive argument that “smart money buying into Bitcoin may signal a top.” We weren't saying the digital currency couldn't go higher then (it obviously did), nor are we about to make that pronouncement now. Rather, in the current environment, competition from other, less expensive cryptocurrencies with better potential for massive gains on a percentage basis are siphoning demand away from Bitcoin.
BTC technicals are signaling demand weakness. Based on that, we're now bearish.

We have been monitoring the development, then the completion, of a rising wedge, bearish after a climactic rally. When Bitcoin couldn’t resume the same rate of ascent after the completion, demand floundered, leaving sellers with little support.
The wedge would have seen the price go back to the $40,000s but the pattern that emerged from the breakout—coupled by a return move to the wedge—puts a H&S on the table. The neckline is downward sloping, manifesting the slumping demand that couldn’t even muster a proper right shoulder. A downside breakout would target the $30,000 level.
Trading Strategies – Short Position Setup
Conservative traders should wait on a short for the price to complete the H&S pattern.
Moderate traders would short upon a bearish candle, confirming the right shoulder’s resistance.
Aggressive traders could short at will, having accepted the added risk to match the higher reward of entering a position with no confirmation, in order to make a move ahead of the market. Money management is especially crucial for higher risk positions.
Here’s an example:
Trade Sample
- Entry: $58,200
- Stop-Loss: $58,700
- Risk: $500
- Target: $48,200
- Reward: $10,000
- Risk:Reward Ratio: 1:20
Author's Note: The above is just a sample, not the full analysis. This trade can be approached in diverse ways, depended upon your risk aversion, budget and timing. Until you learn how to draw your own trade plans, use ours, but only for the purpose of learning, not necessarily profiting. Otherwise, you’ll end up with neither.
