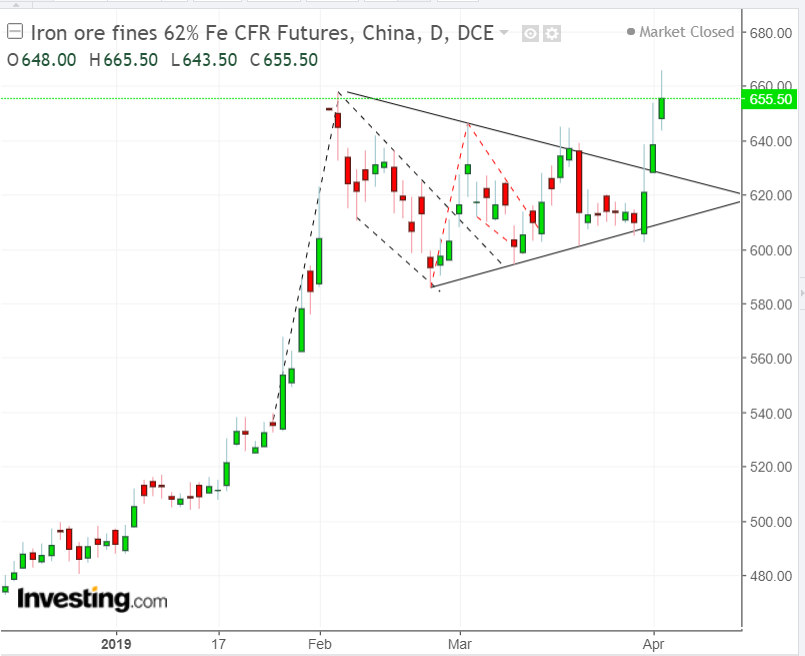
Iron ore was up more than 4% today, though it ultimately settled 2.63% higher. This brings the current rally to its third straight day and an accumulated gain of 7.46%.
We expect the rally to resume, despite the current fundamental drivers, a tropical storm that rammed the cost of Western Australia, forcing local producers BHP (NYSE:BHP) and Rio Tinto (NYSE:RIO) to cut output forecasts. As well, there's another headwind still in affect: as recently as two weeks ago, the outlook was already gloomy after a court ruling permitted the Brazilian miner Vale (NYSE:VALE), the world’s largest producer, to reopen one of its biggest mines, which had been closed due to a collapse that killed hundreds of people. The expectation of oversupply on slowing global growth depressed prices.
However, we provided a buy signal at that time, based on the balance of supply and demand via technical analysis. In fact, that was our second, back-to-back buying recommendation within a month, despite weakening fundamentals. The price has risen since as much as 12 percent. Based on current technicals, we now expect another rally.
The latest three-day rally extends an upside breakout of a symmetrical triangle, the trading range of which included two consecutive falling flags, marked in the black, then red, dotted lines. Their dynamics are described in the links above.
The symmetrical triangle demonstrates that while the pause was driven by an equal commitment from bulls and bears, buyers were more persistent, as they sought further supply above the converging trade range since early February. This over-eagerness establishes two dynamics, one of sentiment and one of market mechanics.
In terms of sentiment, the breakout creates an overall psychological framework, in which traders see that prices are rising more than they recently have been, and they're afraid to lose out on what they may consider a repeat of the sharp uptrend that preceded the pause.
From a practical perspective, traders have been building positions according to the boundaries of the trading range. When the breakout occurred, bearish traders were forced to cover shorts, which increased demand pressure as they rushed to buy contracts before they could go up even higher, in order to be able to return them to their brokers.
Bullish traders set up buy orders above the upper boundary of the price congestion for just this upside breakout scenario, known as a short squeeze, and the undecideds then realize that a second rally is probably kicking off, so they throw their hats into the game. In this structure, most market participants are expected to add their weight to the demand side of the scale.
Trading Strategies
Conservative traders would wait on a long position for the likely return move after a breakout, to retest the pattern’s integrity, with at least a single long, green candle engulfing a red or small candle of either color.
Moderate traders would wait for the pullback before entering a long position, but not necessarily for testing the trend, rather for simply an entry closer to its presumed support, thereby limiting exposure.
Aggressive traders may enter a contrarian short, counting on a downward correction much like that which followed both the upside breakout as well as the three-day rally. Also, the price was forced back down below the Feb. 12 peak, demonstrating oversupply at these levels, increasing the likelihood of a downward correction.
Trade Sample
- Entry: 660.50
- Stop-Loss: 665.50
- Risk: 5
- Target: 630.50
- Reward: 30
- Risk-Reward Ratio: 1:6

