(Adds latest prices)
Sept 22 (Reuters) - U.S. natural gas futures held near a seven-week low on Tuesday as an expected drop in output to its lowest in two years offset a forecast decrease in liquefied natural gas (LNG) exports.
Front-month gas futures NGc1 fell 0.1 cents, or 0.1%, to settle at $1.834 per million British thermal units (mmBtu), their lowest close since July 31 for a second day in a row after the contract dropped over 10% in the prior session.
Traders said futures, which were down about 33% since hitting an eight-month high in late August, were mostly following the spot market lower.
Next-day gas at the Henry Hub NG-W-HH-SNL benchmark in Louisiana plunged to an 11-year low of $1.331 per mmBtu for Tuesday, putting it down almost 50% since it hit a nine-month high in late August.
Data provider Refinitiv said output in the Lower 48 U.S. states was on track to fall to 83.9 billion cubic feet per day (bcfd) on Tuesday, its lowest since August 2018, as Tropical Storm Beta swirls along the Texas Coast. That drop occurred even though producers said they did not expect much damage from Beta.
With prices expected to remain relatively low, Refinitiv projected demand, including exports, would rise from 81.4 bcfd this week to 83.7 bcfd next week as electric generators burn more gas instead of coal to produce power. That, however, was below Refinitiv's forecasts on Monday due mostly to reduced LNG exports.
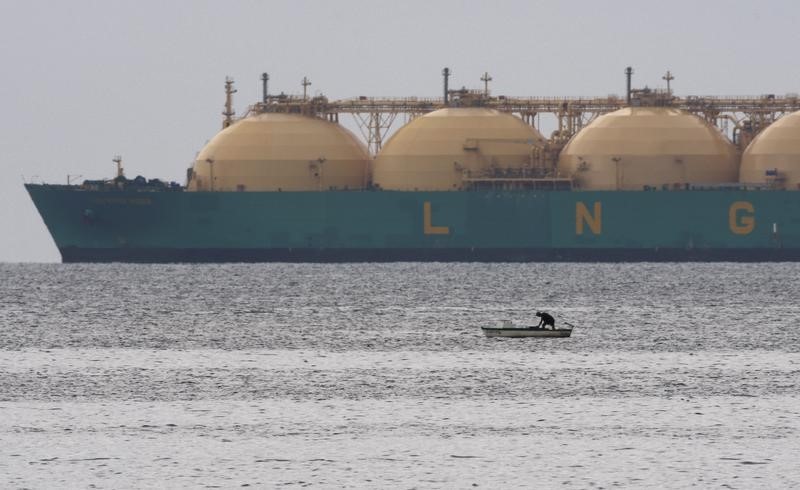
The amount of gas flowing to LNG export plants was on track to slide to a two-week low of 3.9 bcfd on Tuesday from a four-month high of 7.9 bcfd last week due to planned maintenance at Dominion Energy Inc's D.N Cove Point in Maryland, the continued outage at Cameron in Louisiana and as some vessels steer clear of Beta. ended
Week ended
Year ago Five-year
Sep 18
Sep 11
Sep 18
average
(Actual)
(Actual)
Sep 18
U.S. natgas storage (bcf):
+74
+89
+97
+80
Refinitiv Heating (HDD), Cooling (CDD) and Total (TDD) Degree Days
Two-Week Total Forecast
Current Day
Prior Day
Prior Year 10-Year
30-Year Norm
Norm
U.S. GFS HDDs
48
40
37
52
70 U.S. GFS CDDs
85
88
137
91
73 U.S. GFS TDDs
133
128
174
143
143
Refinitiv U.S. Weekly GFS Supply and Demand Forecasts
Prior Week
Current Week Next Week This Week
Five-Year
Last Year Average For
Month U.S. Supply (bcfd) U.S. Lower 48 Dry Production
86.4
86.1
85.9
93.7
79.7 U.S. Imports from Canada
5.7
5.6
6.2
8.1
8.1 U.S. LNG Imports
0.0
0.0
0.0
0.0
0.1 Total U.S. Supply
92.2
91.7
92.1
101.8
87.7
U.S. Demand (bcfd) U.S. Exports to Canada
2.0
2.0
2.0
2.5
2.3 U.S. Exports to Mexico
5.8
6.0
6.1
5.8
4.5 U.S. LNG Exports
6.9
5.3
5.1
6.1
2.1 U.S. Commercial
4.9
5.2
5.2
4.8
4.7 U.S. Residential
4.1
4.6
4.7
3.9
3.7 U.S. Power Plant
33.8
30.5
32.7
33.8
32.0 U.S. Industrial
21.5
21.6
21.7
21.2
20.6 U.S. Plant Fuel
4.3
4.3
4.2
4.3
4.4 U.S. Pipe Distribution
1.9
1.8
1.9
1.8
1.9 U.S. Vehicle Fuel
0.1
0.1
0.1
0.1
0.1 Total U.S. Consumption
70.7
68.1
70.6
69.9
67.4 Total U.S. Demand
85.4
81.4
83.7
84.3
76.3
SNL U.S. Natural Gas Next-Day Prices ($ per mmBtu)
Hub
Current Day
Prior Day
Henry Hub NG-W-HH-SNL
1.33
1.56
Transco Z6 New York NG-CG-NY-SNL
0.78
1.04
PG&E Citygate NG-CG-PGE-SNL
3.50
3.30
Dominion South NG-PCN-APP-SNL
0.73
0.87
Chicago Citygate NG-CG-CH-SNL
1.44
1.46
Algonquin Citygate NG-CG-BS-SNL
1.05
0.95
SoCal Citygate NG-SCL-CGT-SNL
2.51
2.24
Waha Hub NG-WAH-WTX-SNL
0.90
0.98
SNL U.S. Power Next-Day Prices ($ per megawatt-hour)
Hub
Current Day
Prior Day
New England EL-PK-NPMS-SNL
20.75
14.75
PJM West EL-PK-PJMW-SNL
18.75
16.50
Ercot North EL-PK-ERTN-SNL
16.00
17.00
Mid C EL-PK-MIDC-SNL
30.29
29.19
Palo Verde EL-PK-PLVD-SNL
36.25
24.50
SP-15 EL-PK-SP15-SNL
32.75
27.00
