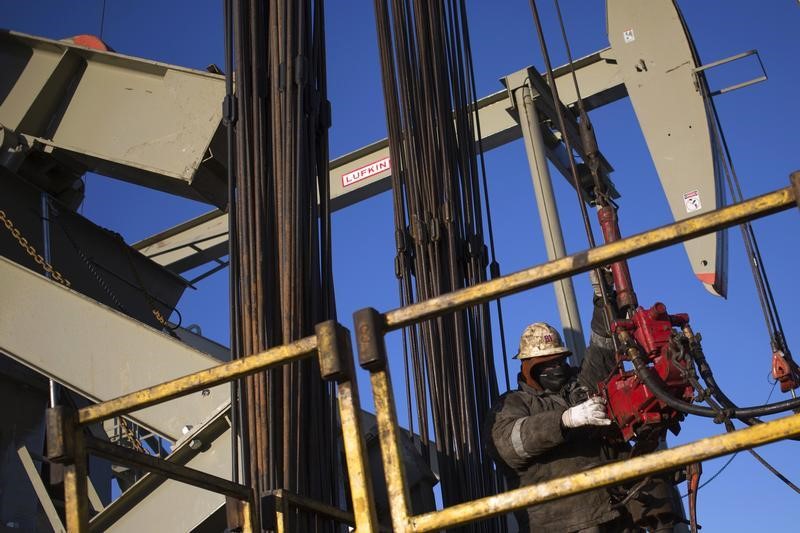
March 22 (Reuters) - U.S. energy firms this week reduced the number of oil rigs operating for a fifth week in a row to its lowest in nearly a year as independent producers follow through on plans to cut spending on new drilling with the government cutting its growth forecasts for shale output.
Drillers cut nine oil rigs in the week to March 22, bringing the total count down to 824, the lowest since April 2018, General Electric (NYSE:GE) Co's GE.N Baker Hughes energy services firm said in its closely followed report on Friday. RIG-OL-USA-BHI
That is the first time the rig count has declined for five weeks in a row since May 2016 when it fell for eight consecutive weeks.
More than half the total U.S. oil rigs are in the Permian basin, the nation's biggest shale oil field, where active units fell by six this week to 459, the lowest since May 2018.
The U.S. rig count, an early indicator of future output, is still a bit higher than a year ago when 804 rigs were active after energy companies boosted spending in 2018 to capture higher prices that year.
Drilling this year has slowed with the rig count contracting for the past three months as independent exploration and production companies cut spending as they focus on earnings growth instead of increased output with crude prices projected to decline in 2019 versus 2018.
U.S. oil output from seven biggest shale formations, the nation's major producing regions, was expected to rise by 85,000 barrels per day (bpd) in April to a record 8.59 million bpd, the U.S. Energy Information Administration said in its monthly drilling productivity report on Monday. increase, however, would be the smallest monthly increase since May 2018, continuing a pattern of shrinking growth.
The EIA last week already forecast total crude production was expected to grow slower than previously expected in 2019 but still average a record high 12.3 million bpd, from the all-time high at 11.0 million bpd in 2018. crude futures CLc1 rose over $60 a barrel this week for the first time in four months due to supply cuts by the Organization of the Petroleum Exporting Countries (OPEC) and its allies and U.S. sanctions on Iran and Venezuela. O/R
Looking ahead, crude futures were trading around $59 a barrel for the balance of 2019 CLBALst and near $58 in calendar 2020 CLYstc1 .
U.S. financial services firm Cowen & Co said this week that projections from the exploration and production (E&P) companies it tracks point to a percentage decline in the mid single digits in capital expenditures for drilling and completions in 2019 versus 2018.
Cowen said independent producers expect to spend about 11 percent less in 2019, while international oil companies plan to spend about 16 percent more.
The majors' rising investment reflects a recognition that Exxon Mobil Corp (NYSE:XOM) XOM.N , Chevron Corp (NYSE:CVX) CVX.N , Royal Dutch Shell RDSa.L and BP Plc BP.L largely missed out on the first phase of the Permian shale bonanza while more nimble independent producers, who pioneered shale drilling technology, leased Permian acreage on the cheap. total, Cowen said all of the E&P companies it tracks that have reported will spend about $81.0 billion in 2019 versus $85.5 billion in 2018.
There were 1,016 oil and natural gas rigs active in the United States this week, according to Baker Hughes. Most rigs produce both oil and gas.
Analysts at Simmons & Co, energy specialists at U.S. investment bank Piper Jaffray, this week forecast the average combined oil and gas rig count will fall from 1,032 in 2018 to 999 in 2019 before rising to 1,087 in 2020. That was the same as its predictions since the start of the year.
<^^^^^^^^^^^^^^^^^^^^^^^^^^^^^^^^^^^^^^^^^^^^^^^^^^^^^^^^^^^ Graphic on U.S. rig counts
http://graphics.thomsonreuters.com/15/rigcount/index.html U.S./Canada natural gas rig count versus Henry Hub futures price
http://tmsnrt.rs/2eT9k44 Shale oil breakevens
http://tmsnrt.rs/2fO4b17
^^^^^^^^^^^^^^^^^^^^^^^^^^^^^^^^^^^^^^^^^^^^^^^^^^^^^^^^^^^>
