Kalkine Media -
Based out of Calgary, Alberta, Suncor Energy Inc. (TSX: TSX:SU) is a Canadian integrated energy company, with oil sands development, offshore oil and gas, petroleum refining, and production & upgrading operations in Canada and the US.Highlights
- In 2022, Suncor Energy returned C$ 8 billion to its shareholders compared to C$ 3.9 billion in 2021.
- The integrated energy company achieved record adjusted FFOs of C$ 18 billion in Q4’22.
- Syncrude, Suncor’s joint venture, produced record synthetic crude oil (SCO) in the fourth quarter of 2022.
On February 14, 2023, Suncor Energy revealed its fourth quarter 2022 results. According to which, the company returned approximately C$ 7.7 billion to its shareholders in fiscal 2022 (C$ 3.9 billion in 2021). Not only this, but Suncor also mentioned ending the year with the highest-ever dividend per share of C$ 0.52, an increase of 23.8 per cent year-over-year (YoY).
With that being said, let’s flick through Suncor’s stock performance post the positive Q4 results:
Share Performance of Suncor Energy Following the positive fourth-quarter results, Suncor Energy shares were spotted trading in the green territory, with a positive change of 1.47 per cent. One share of Suncor was priced at C$ 46.38, representing an increase of C$ 0.67 from the previous trading session.
Over the last seven trading sessions, the stock price of Suncor improved by 1.47 per cent, and over the previous 30 days, it has increased in value by 0.43 per cent as of February 15, 2023.
Apart from this, this integrated energy company holds a total market share of C$ 61.663 billion, with earnings per share of C$ 5.52 and a P/E ratio of 8.29.
Suncor Energy Q4 2022 results During the fourth quarter of 2022, the company grew its adjusted FFOs from C$ 3.144 billion in Q4’21 to C$ 4.189 billion. Cash flows from operating activities also increased in Q4’22 to C$ 3.924 billion, up from C$ 2.615 billion in the prior comparable period.
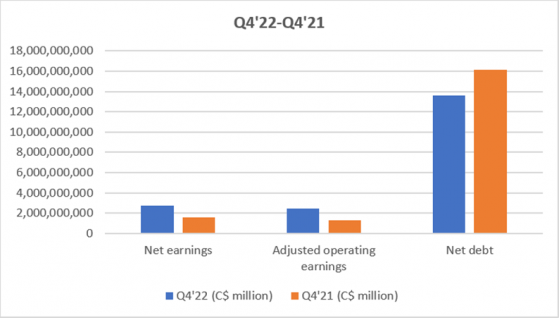
Adjusted operating earnings during the fourth quarter of 2022 reached C$ 2.432 billion, representing an increase from C$ 1.294 billion in Q4’21. Suncor’s net earnings also witnessed growth in Q4’22, up from C$ 1.553 billion in Q4’21 to C$ 2.741 billion.
In addition, Suncor reduced its net debt by about C$1 billion in the fourth quarter of 2022 and by C$ 2.5 billion in the full year 2022.
The company’s financials are summarized in the chart below:
Image Source: © 2023 Krish Capital Pty. Ltd.
In addition to the financials, the company's oil sands assets produced 688,100 barrels per day (bbls/d) in the fourth quarter of 2022 as opposed to 665,900 bbls/d in the same period last year.
On the other hand, Syncrude produced record amounts of synthetic crude oil (SCO) and mining bitumen this year, contributing to Suncor's second-highest annual SCO output of 480,000 barrels per day.
During Q4’22, the company also sold its wind and solar assets and bought another working interest in Fort Hills, increasing its total aggregate working interest in Fort Hills to 68.76 per cent.
Bottom Line The equity market is still recovering from inflationary and recessionary pressures triggered during the second half of 2022. Therefore, before putting your hard-earned money in the stock market, investors should conduct thorough market research.
Please note, the above content constitutes a very preliminary observation based on the industry and is of limited scope without any in-depth fundamental valuation or technical analysis. Any interest in stocks or sectors should be thoroughly evaluated taking into consideration the associated risks.
