


Sign up to create alerts for Instruments,
Economic Events and content by followed authors
Free Sign Up Already have an account? Sign In
Please try another search
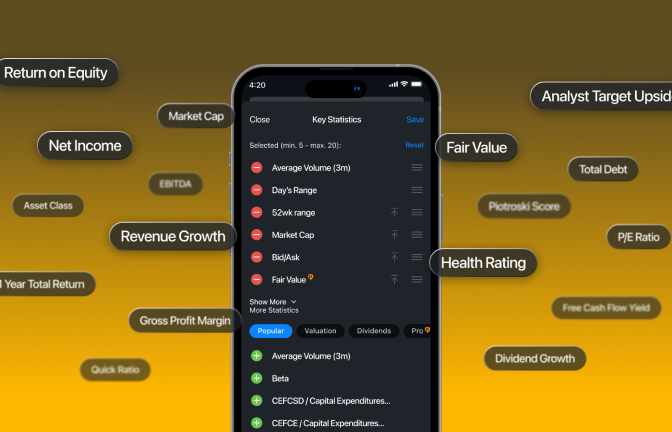
Finally: there’s now a better way to review key data at a glance for the assets that interest you.
New to the Investing.com app, discover a vastly expanded list of 175 key statistics (quite an upgrade from our previous offering of 15) for you to prioritize as you wish. Drag-and-drop your preferred metrics like Free Cash Flow or Return on Assets into the order that works best for your strategy - and voilà! Your important data, exactly your way.
Up until now you probably would’ve needed to toggle between different apps or websites to view these metrics on one screen. But now, no matter how you invest, you can optimize your experience to supercharge your strategy.
The 175 metrics incorporate rich data that helps counter risks, such as Cash Ratio or Financial Leverage, as well as Health Score and Revenue Growth, which flag high-potential investments for maximum return possibilities. Select premium metrics are available only to InvestingPro subscribers.
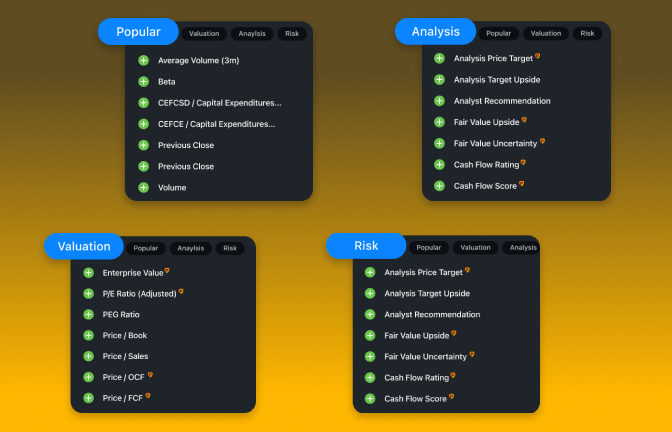
To make your strategizing even smoother and inspire fresh ideas, you’ll also find different categories with suggestions for relevant key statistics. This includes views favoring growth stock aficionados, ratios, risk, returns, ETFs, and even popular statistics on the web.
In other words, it’s all totally your call.
If you’re a dividend-hungry investor, tap the “Dividend” view to reveal the must-have metrics for detecting dividend winners. Add the suggested statistics (especially Dividend Payout Ratio and Dividend Coverage Ratio) to the asset of your choice to quickly see if it appeases your appetite.
Additional views for key statistics ideas based on investment strategies include:
“Our users prioritize different things when vetting their investments, and we wanted them to fully embrace whatever strategy they wished,” says Rafael Halio, Director of Product Experience at Investing.com. “With this huge time-saver of customizable Key Statistics, now they can expand their view of their equities with so much less effort. Our team is thrilled to give investors another new edge of confidence and freedom.”
Got feedback? Share your thoughts as we continue to make the Investing.com experience better. Feel free to reach out to our support team anytime.
Are you sure you want to block %USER_NAME%?
By doing so, you and %USER_NAME% will not be able to see any of each other's Investing.com's posts.
%USER_NAME% was successfully added to your Block List
Since you’ve just unblocked this person, you must wait 48 hours before renewing the block.
I feel that this comment is:
Thank You!
Your report has been sent to our moderators for review
Add a Comment
We encourage you to use comments to engage with users, share your perspective and ask questions of authors and each other. However, in order to maintain the high level of discourse we’ve all come to value and expect, please keep the following criteria in mind:
Perpetrators of spam or abuse will be deleted from the site and prohibited from future registration at Investing.com’s discretion.