- All Instrument Types
- Indices
- Equities
- ETFs
- Funds
- Commodities
- Currencies
- Crypto
- Bonds
- Certificates
Please try another search

What This Week's Oil Inventories Signal About Trending Demand, U.S. Economy

Yesterday, the EIA announced a 7.1 million barrel increase in crude oil stocks in the U.S. This brings current U.S. oil inventories to just above the 450 million barrel mark. Put in context, this is higher than oil stores were at this time last year, but not nearly as high as they were in 2017 or 2016 when crude oil stocks were at 528 million barrels and 491 million barrels, respectively.

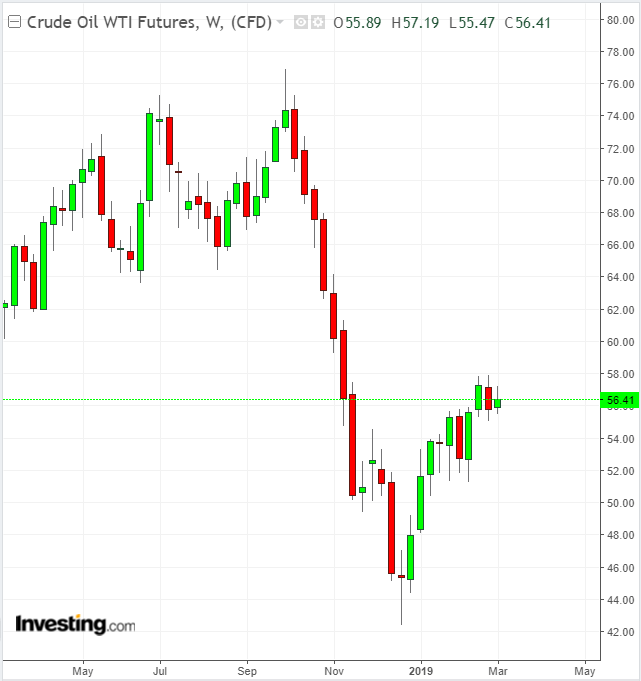
The data from the EIA matched the numbers released by API on Tuesday. WTI dropped slightly after these reports on both Tuesday and Wednesday, but declines were small in comparison to the drop in oil prices markets witnessed after U.S. President Trump tweeted about OPEC last week.
The market did not overreact to the EIA and API reports, because the build in crude oil stores is seasonally appropriate. In addition to seeing a build in crude oil stores, we also saw a draw in gasoline stores of 4.2 million barrels.
This is also very typical for the current season. Refineries in the U.S. are undergoing maintenance and switching over from producing winter blend gasoline to summer blend gasoline. This means that gasoline stations are drawing on stored winter blend gasoline to satisfy customer demand and refineries are not processing as much crude oil as they typically do. According to GasBuddy, these types of gasoline draws will continue until refinery maintenance comes to a close.
The key element to take away from the EIA report is that the large build in crude oil stocks is not indicative of faltering demand for oil in the U.S. or globally. Gasoline demand is still strong, and jet fuel demand is only slightly lower.
The crude oil builds are a result of normal seasonal variation, not overall economic weaknesses. As we head into the summer driving season, the numbers will start to give us a better indication of whether an economic slowdown is indeed taking shape and whether a potential slowdown will negatively impact crude oil and gasoline demand in the United States.
Strong gasoline demand between Memorial Day and Labor Day (the end of May and the beginning of September) could indicate that the demand weakness forecast by many analysts is not going to impact the United States. However, it will be important to watch the numbers over the entire season, as one or two weeks’ data is not indicative of a larger trend.
Related Articles

Energy prices are under pressure amid demand concerns and improving prospects for a Russia-Ukraine peace deal. But tariff risks continue to hit metal markets Energy-WTI Below...

Gold prices surged to an all-time high of $2,940 per ounce last Thursday, pushing its market cap above $20 trillion for the first time ever, as trade tensions between the U.S. and...

Gold remains at technically overbought levels across multiple time frames, with RSI showing negative divergence, signaling potential weakness. Gold’s strong correlation with the...
Are you sure you want to block %USER_NAME%?
By doing so, you and %USER_NAME% will not be able to see any of each other's Investing.com's posts.
%USER_NAME% was successfully added to your Block List
Since you’ve just unblocked this person, you must wait 48 hours before renewing the block.
I feel that this comment is:
Thank You!
Your report has been sent to our moderators for review


Add a Comment
We encourage you to use comments to engage with users, share your perspective and ask questions of authors and each other. However, in order to maintain the high level of discourse we’ve all come to value and expect, please keep the following criteria in mind:
Perpetrators of spam or abuse will be deleted from the site and prohibited from future registration at Investing.com’s discretion.