This article was written exclusively for Investing.com
- US-China trade weighs on the price of the fluffy fiber
- 2020 markets look a lot like 2008
- Oversupply leads to the bottom-end of pricing cycles in commodities
Cotton is perhaps one of the most volatile commodities to trade on the futures exchange. Since 1972, the price of the fluffy fiber has traded from a low of 26.44 cents to as high as $2.27 per pound. The leading cotton-producing countries in the world are China, India, the United States, and Pakistan. China and India are the leading consumers.
Each year, weather conditions in producing nations determine the size of the crop. However, 2020 has been anything but typical.
The global pandemic has weighed on the demand side of the equation, as has the ongoing trade friction between the US and China. Cotton is a member of the soft commodities sector of the asset class. Cotton futures trade on the Intercontinental Exchange. The price was just below 60 cents per pound at the end of last week on the now active month December futures contract.
US-China trade weighs on the price
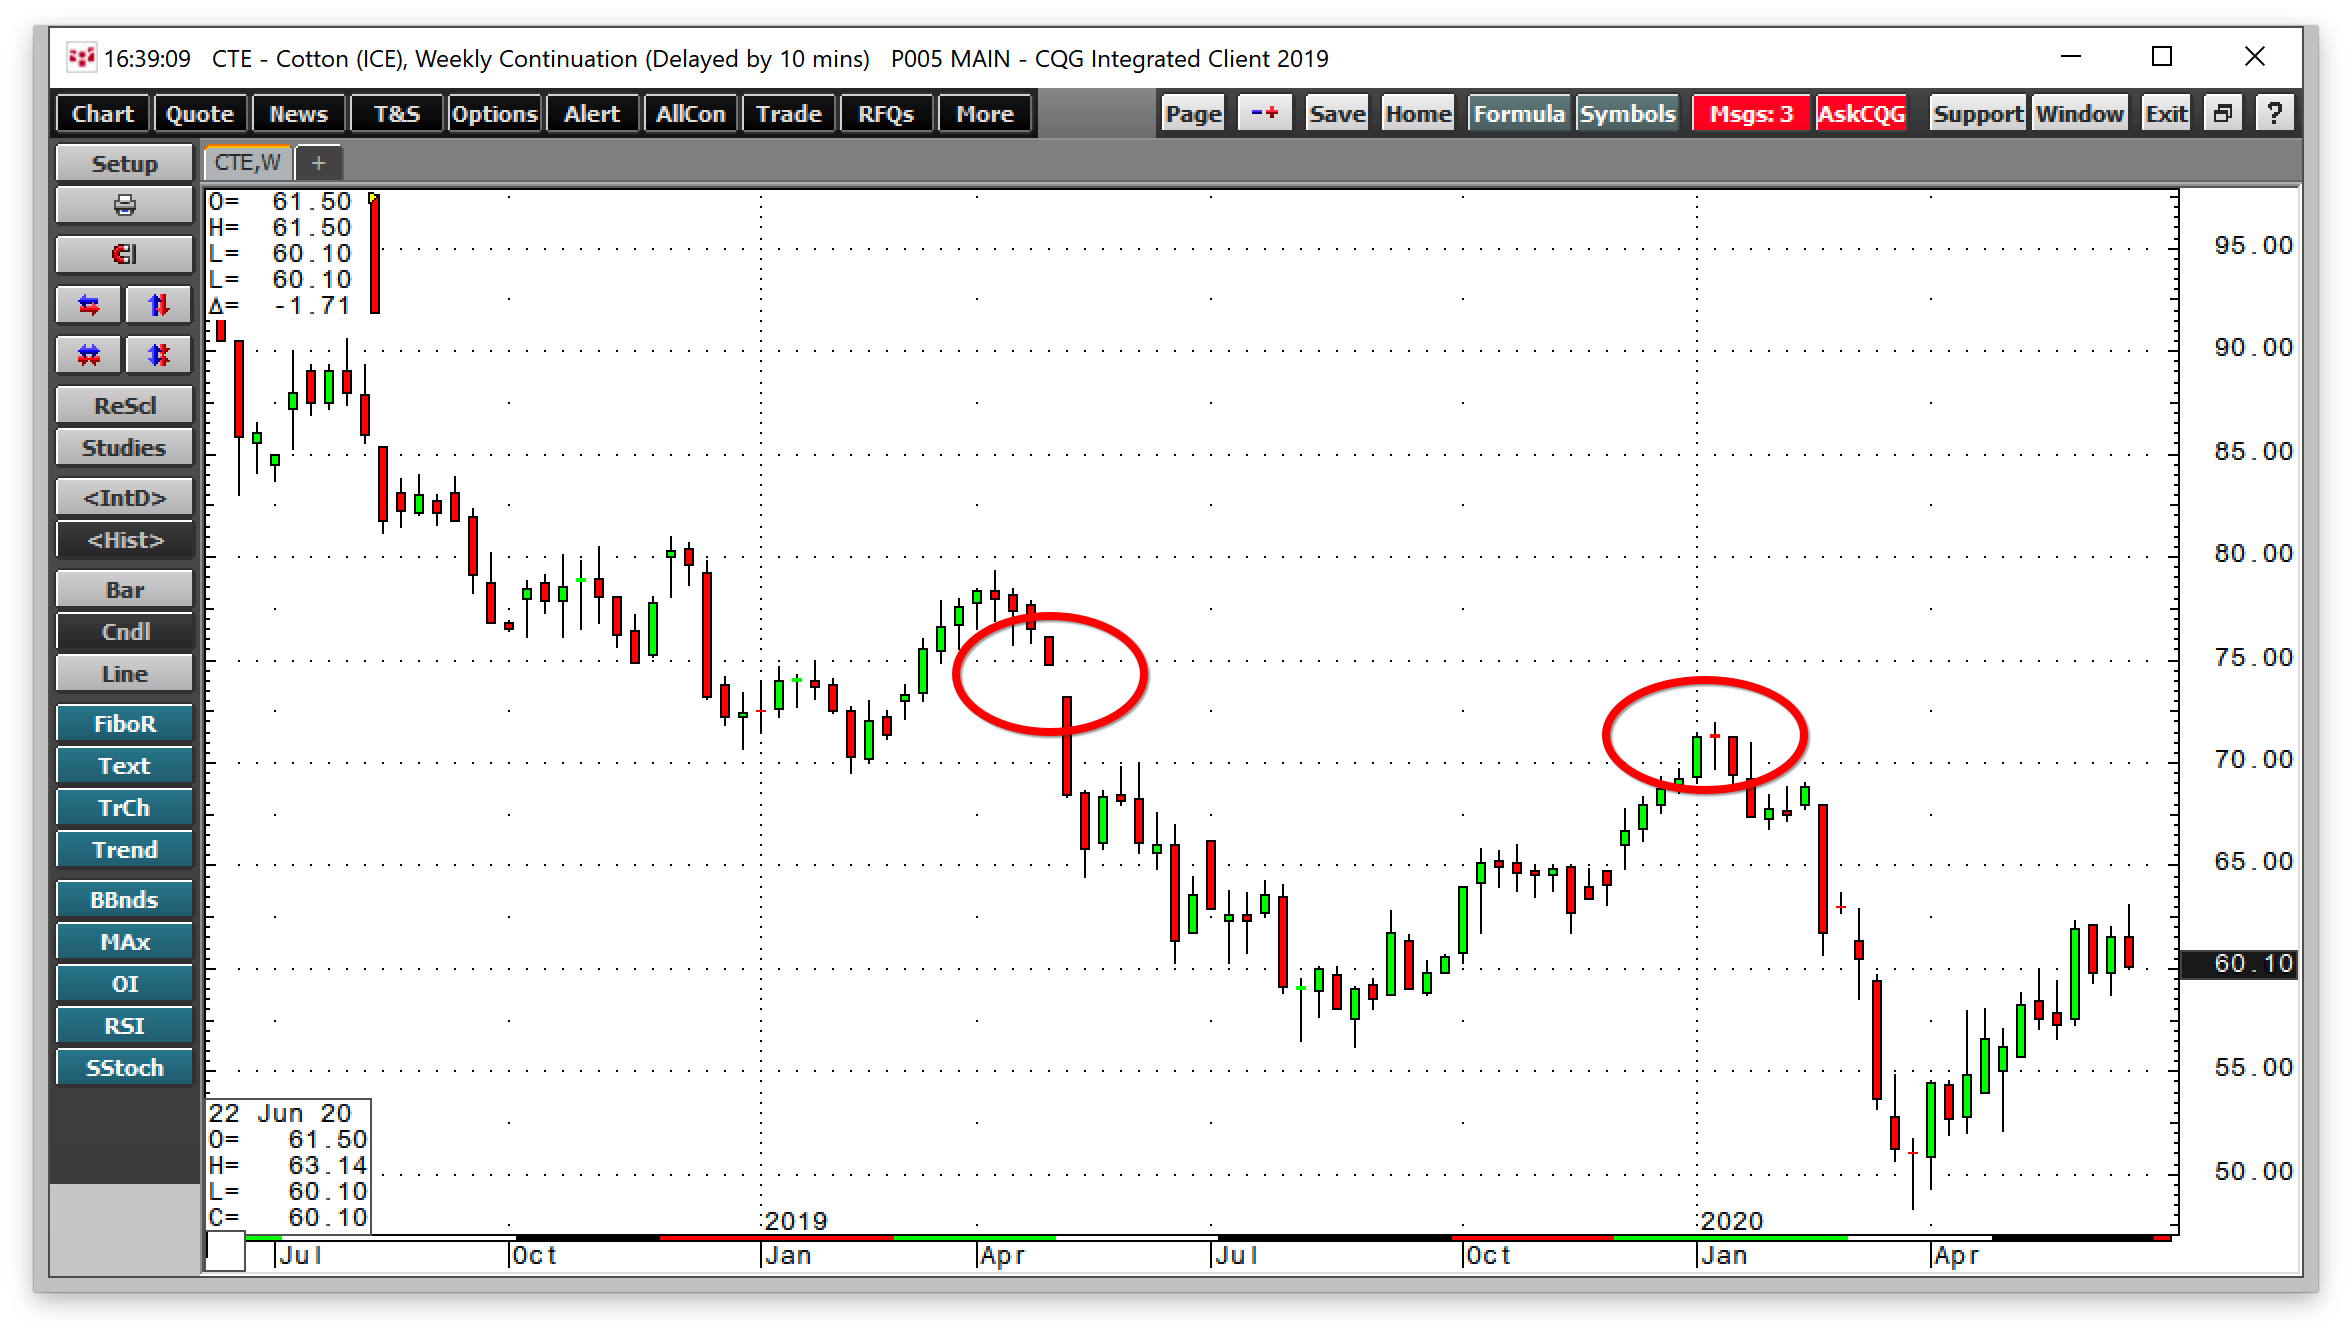
In early January 2020, optimism over the “phase one” trade deal between the US and China lifted the price of nearby cotton futures on the Intercontinental Exchange to almost 72 cents per pound.

Source, all technical charts: CQG
The weekly cotton chart, above, highlights a gap dating back to the weeks of April 29, 2019, and May 6, 2019, from 74.78 to 73.20 cents per pound. In early January, when the market believed that the first trade deal between the US and China was a stepping stone to a comprehensive agreement, cotton made it to a high of 71.96 cents per pound.
But the market ran out of steam, and the spread of COVID-19 around the world created two problems for the light-weight fiber. First, the demand for consumer goods evaporated as factories shut down to limit the spread of the virus. Second, China’s behavior at the start of the pandemic caused friction with the US and other nations around the world.
The price of cotton futures dropped to a low of 48.35 cents per pound in March, while markets across all asset classes were collapsing. Cotton traded at its lowest price since 2009 in the aftermath of the global financial crisis. In 2008, nearby cotton futures found a bottom at 36.70 cents per pound.
2020 markets look a lot like 2008
There are many similarities between the price action in commodities markets in 2008 and 2020. The global financial crisis a dozen years ago triggered a period of risk-off behavior on markets that caused prices to drop significantly.
The US Fed and central banks around the world came to the rescue in 2008 by slashing short-term interest rates and purchasing assets that pressured rates further out along the yield curve to drop to historically low levels. In the years that followed, commodities prices experienced sharp rallies that took prices of many raw materials to multiyear or all-time highs in 2011. Cotton was one of the agricultural commodities that reached a record peak in 2011.
In 2020, the response from central banks and governments to coronavirus has been even more extreme than in 2008. The US Treasury borrowed $530 billion from June through September 2008 to fund stimulus measures. In May 2020, the US Treasury borrowed $3 trillion, and more borrowing is likely on the horizon as the number of cases of COViD-19 climbs in parts of the US.
Time will tell if we get a similar result over the coming years in commodities markets, but the price tag for stimulative measures could be highly inflationary. A flood of liquidity weighs on the value of fiat currencies. At the same time, the US Dollar Index has weakened since the March peak that took it to the highest level since 2002 at 103.96.
As of the end of last week, the index stood at below 97.50. Along with unprecedented levels of monetary and fiscal stimulus, a weak US dollar could also ignite commodity prices on the upside over the coming months and years.
Oversupply leads to the bottom-end of pricing cycles in commodities
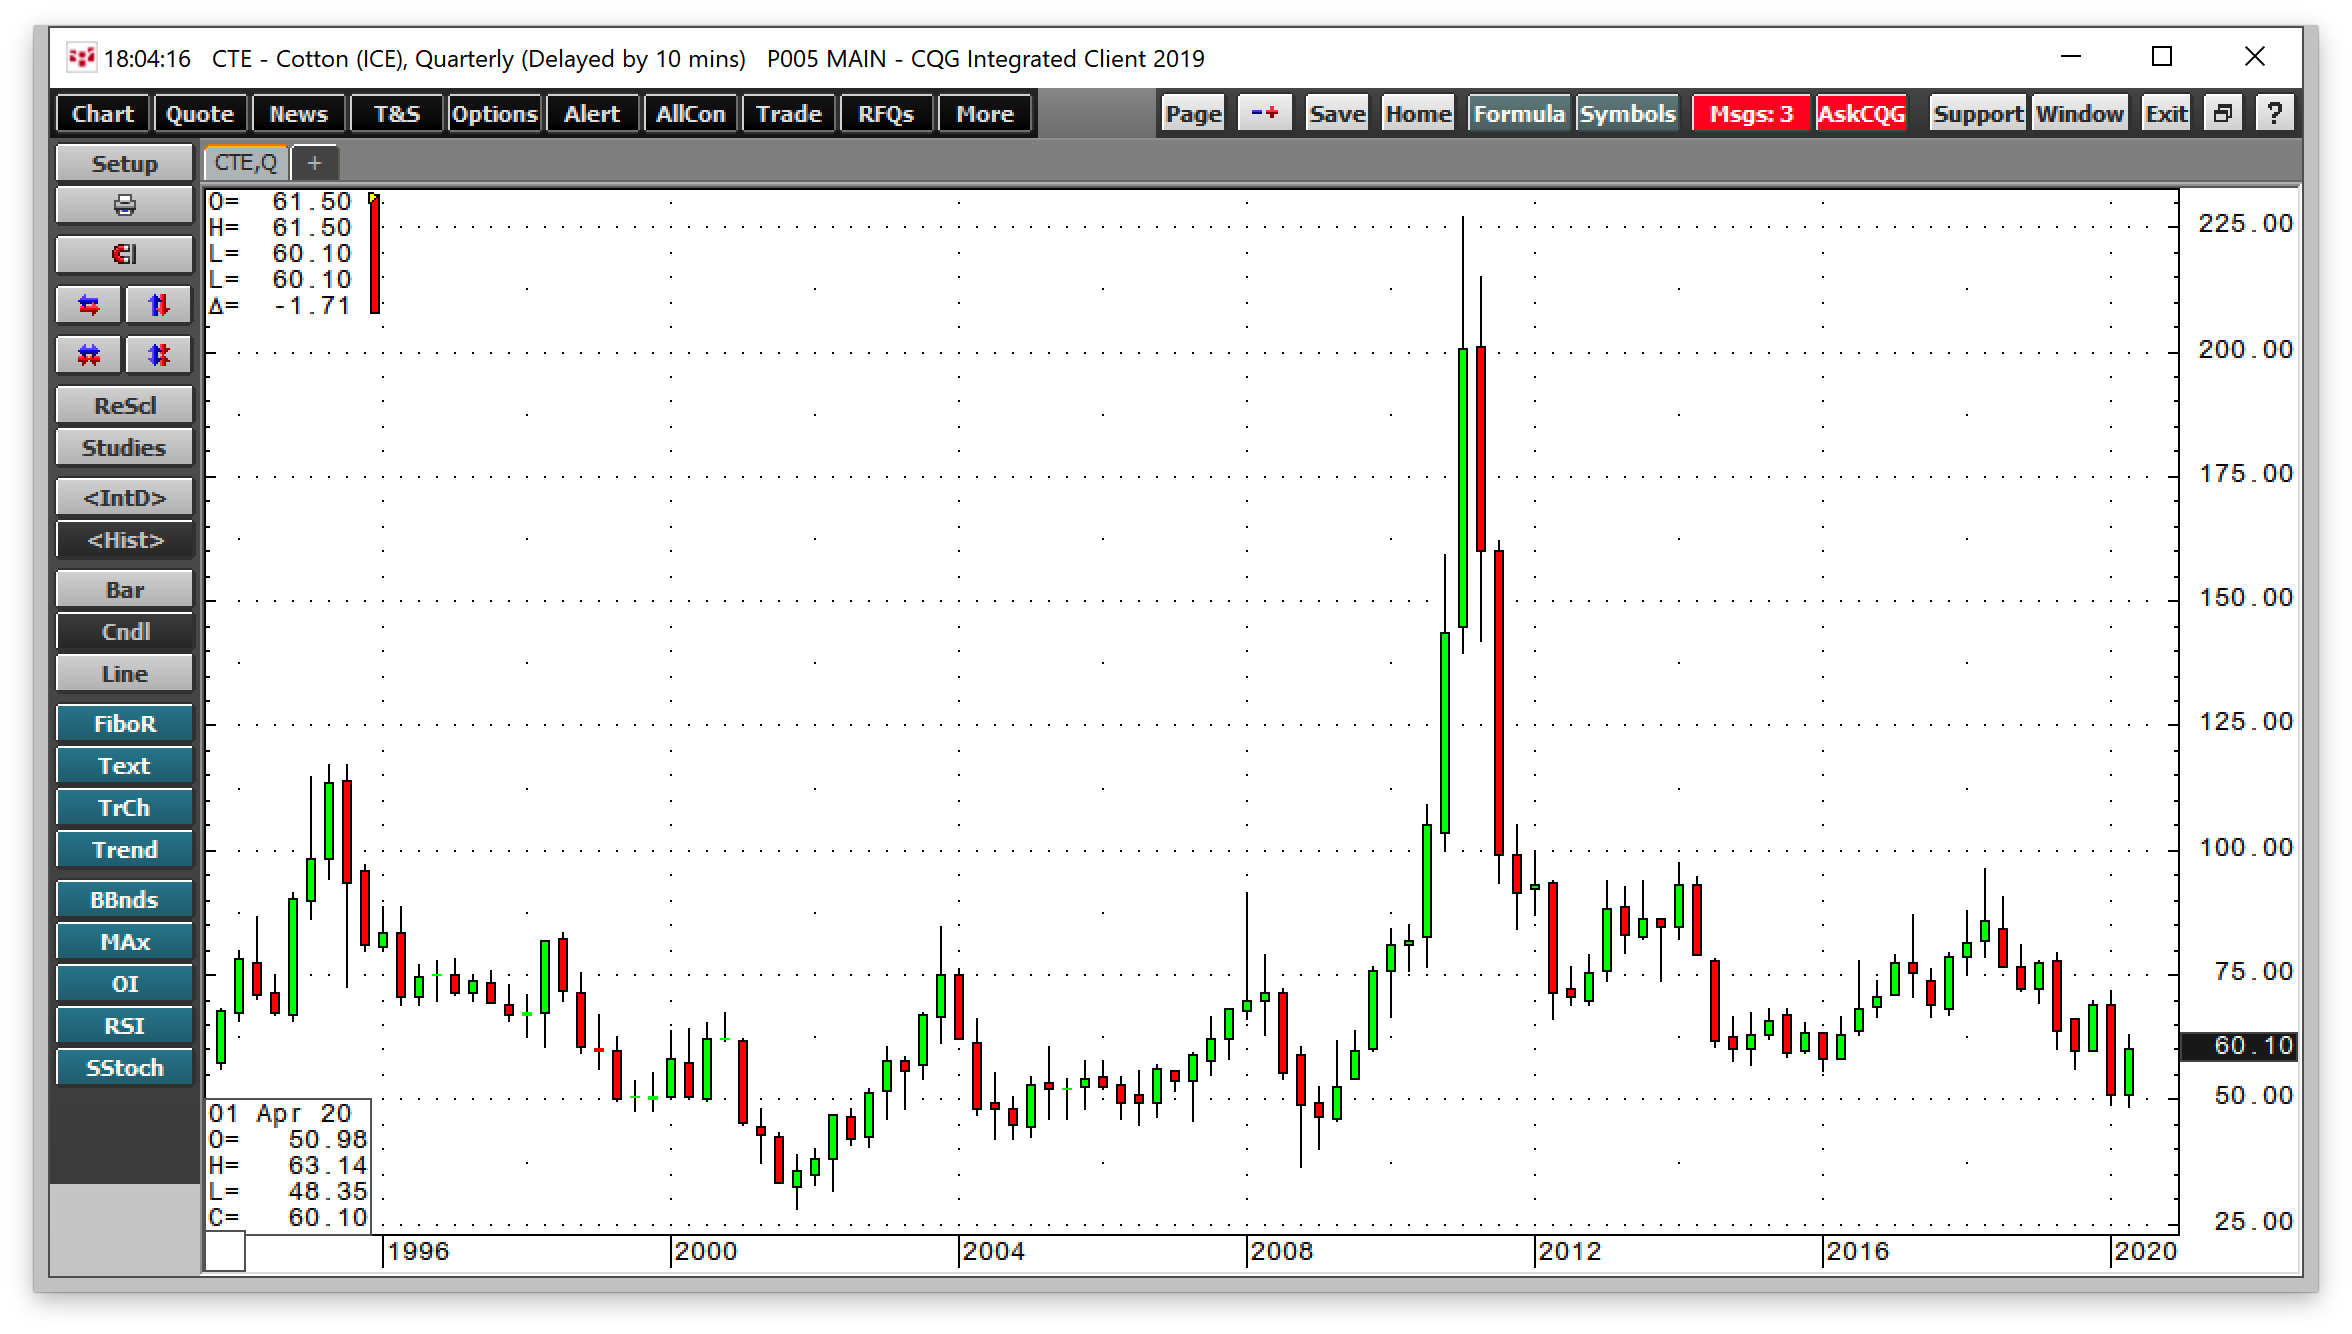
In 2008, cotton dropped to its lowest price since 2001 when it traded at 36.70 cents per pound. Less than three years later, the price was over six times higher.

The quarterly chart above, shows the move that took the price to a high of $2.27 per pound in March 2011. The previous all-time peak for cotton futures was in 1995 at only $1.1720.
At around the 60 cents per pound level at the end of last week, cotton futures continue to experience selling pressure. Technical support is at the March low of 48.35 cents with resistance at the early 2020 peak at just below the 72 cents per pound level.
Cotton is sitting in the middle of the 2020 trading range at 60 cents. If producers begin to cut output and demand returns in 2021 and 2022, we could see a significant recovery in the price of the fiber futures.
The most direct route for a risk position in cotton is via the futures and futures options on the Intercontinental Exchange. For those who wish to speculate on the price of cotton, the iPath Series B Bloomberg Cotton Subindex Total Return ETN (NYSE:BAL) does an excellent job tracking the price of cotton on a short-term basis.

Source: ICE/RMB
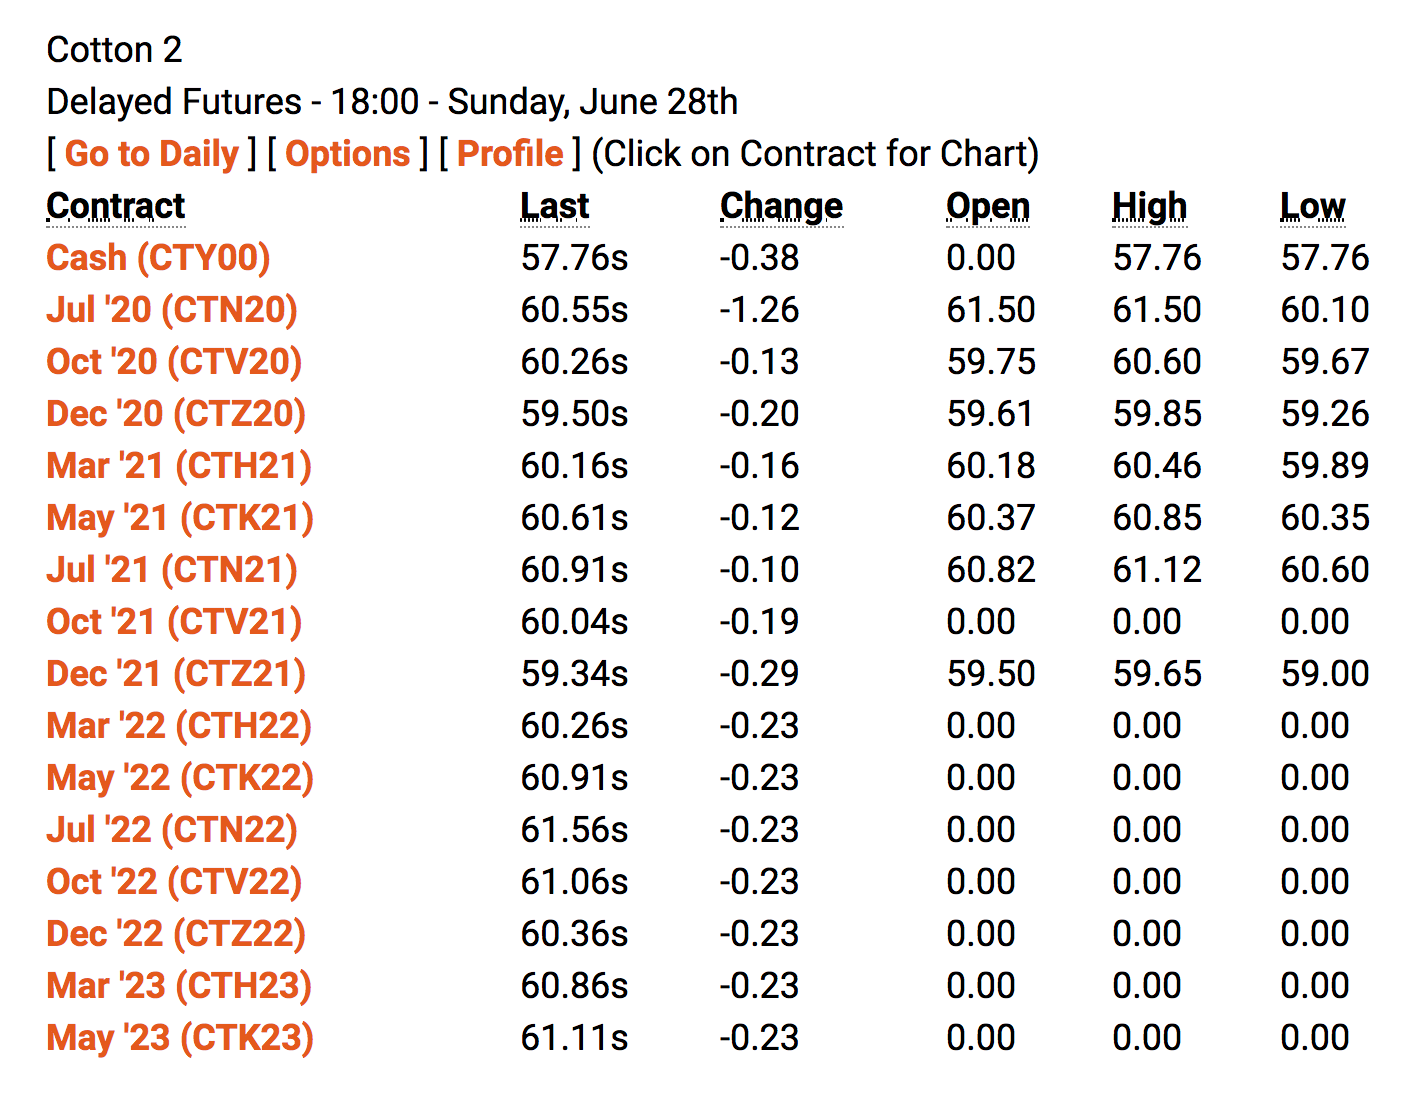
The forward curve in the cotton futures market is relatively flat around the 60-61 cents per pound level. Without contango, the cost of rolling a long position to the next active month is low.
I would only purchase cotton on price weakness in the current environment. The tensions with China and the chance of additional outbreaks of COVID-19 continue to weigh on the price of the agricultural product.
However, if 2020 turns out to be anything like 2008, cotton is currently on sale at a bargain-basement price.
