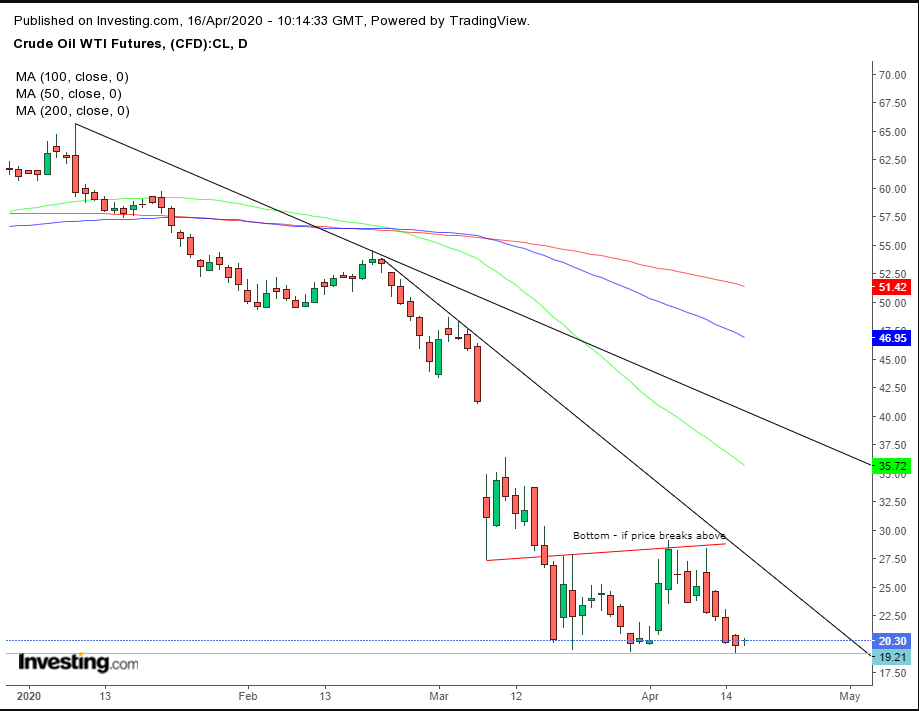
The oil market is in shambles. Everyone says it. Everyone knows it. Yet, the $20.00 line has been holding since March 18, almost a full month.
Has oil carved out a floor? We don’t know, for a number of reasons.
First, because the global market is a mess in general, and the oil market, specifically. There is already talk of “subzero prices,” which would see storage facilities and producers having to cough up cash to unload oil, like people paying someone to get rid of an old refrigerator.
This is a whole new world, one of negative interest rates and energy prices, with the situation continuing to develop. Before COVID-19, OPEC+ dominated the headlines and the cartel was able to flex their oil-price muscles. Now, they're sparring with the World Health Organization, U.S. President Donald Trump and the coronavirus curve in various countries for daily news dominance — all of which also potentially moves the price of crude, one way or another.
At this juncture, the only thing we can trust is price. Irrespective of the fundamental driver, a barrel of oil is sold for a certain charge at a particular moment in time. Right now, we can only attempt to analyze what folks are prepared to pay for oil — having consumed all the known and unknown fundamentals and headlines — and where the price might go based on its trajectory.
Of course, something unexpected could change where the value of oil heads next, but we’re not prophets, we just consider the odds.

Thus, from a risk-reward perspective, a contrarian position is extremely attractive. The price is fluctuating around $1 below yesterday’s low, its lowest in 18 years. On the other hand, the range’s top is aiming at the $30 level. And at this stage, anything could move prices violently.
We expect comments such as we’re delusional, because of A, B or C. As if we’re not aware of the same reasons as everyone else. We also remember the scoffing that ensued when we predicted oil would fall from $60 to $50, then to $40 and finally to $20.
Of course, we don't know if oil will bounce. But, we do know that when all the bad news in the world hasn’t been able to drag an asset lower, then everything seems to be priced in — which in turn allows for a move in the opposite direction.
Should we see a fantastic scenario in which oil rises above $30, this would complete a bottom. Naturally, if prices fall, significantly — in price depth and time, according to various risk levels — below $20, we will reverse our outlook. But for now, we feel comfortable entertaining a contrarian long position.
Trading Strategies
Conservative traders would wait either for a bottom, with a close above $30, or a close below $20, employing a minimum 3% price penetration and a 3-day period in which prices remain within the breakout, preferably including a weekend close.
Moderate traders may enter a long position, if prices produce a long green candle above $20, or short after a long red candle below $20, with at least a 2% filter and 2-day period maintaining the breakout. Then, they’d have to work out the correct entry, stop-loss (that may slip) to provide a justifiable risk-reward ratio.
Aggressive traders may risk a long position at will, providing they first work out a trading plan they can stick to.
Trade Sample
- Entry: $20.00
- Stop-Loss: $19:00
- Risk: $1
- Target: $25
- Reward: $5
- Risk:Reward Ratio: 1:5
Note: This is just a sample. Not every sample is for every trader, nor is every sample expected to win. Traders take multiple trades according to myriad scenarios within a cohesive trading strategy. This sample is simply meant to demonstrate the key components required of viable trading plan. Feel free to change it according to your personal needs. For example, moving the stop-loss to $19.50 — while keeping the same target — doubles the risk-reward ratio, while it increases the possibility of being whipsawed.
