Bitcoin set to refocus on macro as speculative washout eases
This article was written exclusively for Investing.com
It has been one ugly, ugly, day for cryptos. At the time of writing, Doge had lost 25% on the session and XRP was not far off either, being 23% worse off. Meanwhile ETH was down 13%, just a bit more than Bitcoin which had fallen 11% on the session. The latter was now 25% cheaper than when it hit a record high of just under $65K a couple of weeks ago. What is going on and where to next for cryptos and in particular Bitcoin?
Regulatory concerns, valuation fears and bullish exuberance have all led to profit-taking and some short-side interest. There is no doubt that cryptos had also gotten overheated during the hype around the Coinbase (NASDAQ:COIN) IPO.
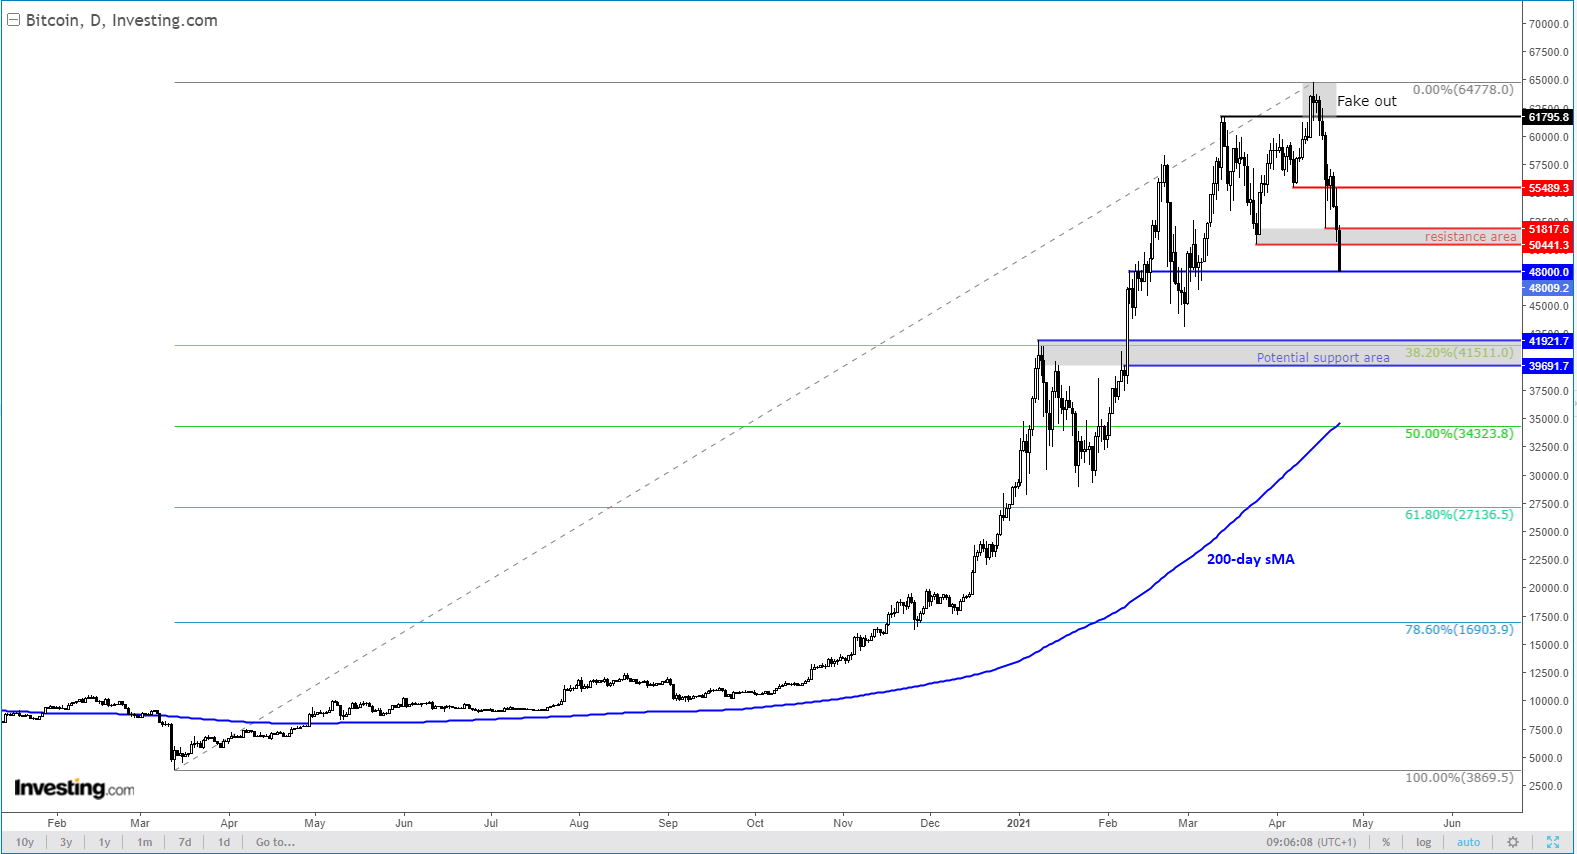
Momentum is another major reason why prices have fallen so sharply. Previously, the momentum was bullish, and prices used to rise for no obvious reasons. But that changed when Bitcoin formed a false break reversal around the $61,800 area. Since then the selling has been getting stronger and stronger with forced closures of leveraged trades etc.
So, as far as the short-term is concerned, the path of least resistance for Bitcoin is clearly to the downside, which means rallies back into former support levels could get faded.

Bitcoin’s reversal from the fakeout around the $61,800 area was confirmed when it formed a lower low beneath $55,500 last Sunday, and the breakdown was further confirmed by a daily close on Wednesday below this level. Since then, it has been a one-way trade. The selling accelerated today after prices took out the Mar. 25 low at $50,440 triggering fresh technical selling below this level.
The $50,440 level is now going to be the lower bound of the first line of defence for the bears. Specifically, the key resistance area to watch is now between $50,440 to $51,820, formerly support.
When to step back in?
Buying Bitcoin right now, especially on leverage, is like trying to catch a falling knife. The bulls need to remain patient now and wait for a proper bullish signal before looking to buy short-term dips again.
That being said, we can speculate where the selling pressure may wane.
One such level is around $48,000, which was being tested at the time of writing. It is possible prices may bounce here, before turning lower again from the above-mentioned resistance range.
The next key area of support is seen around $39,690 to $41,920. As per the chart, this was a key resistance area prior to the price breaking out in early February. In addition, the long-term 38.2% Fibonacci retracement level converges here.
Finally, it is worth noting that last weekend, Bitcoin prices tumbled sharply, leading to further weakness during this week. As we end another eventful week, many traders will be wondering whether more short-term losses are to come over the next couple of days or longer, potentially delaying their decisions to step in on the long side. Bitcoin therefore remains at risk of easing further lower in the short-term outlook.
The longer-term outlook for Bitcoin remains fundamentally bullish owing to its limited supply and growing demand. Many investors will be waiting to jump on the long side once this current weakness cycle ends.
