Yesterday, as expected, the Federal Reserve raised rates. However, the US central bank went one step further and provided an outlook for an additional, fourth hike this year, increasing the median “dot plot” to 2.25-2.5 percent, up from 2.00-2.25 percent.
Surely, that should have boosted the US dollar. Instead, the dollar sold off 0.35 percent from its previous close, or 0.57 percent from its preceding session high, to close at the very lowest pip of the day. The selloff resumed today, taking the greenback another 0.15 percent lower, to an aggregate decline of 0.5 percent.
What's going on?
There are two possible catalysts for the selloff, despite a more hawkish Fed.
The outlook for higher rates is overshadowed by worries that China will increase tariffs to counter those of the US, as the White House debates whether to follow through with the levies on $50 billion worth of Chinese goods after the recent meeting with China failed to reach a deal.
As well, should the ECB announce later today that it will be ending QE as expected, that could weigh on the dollar while boosting the euro, which makes up 57.6 percent of the weighting in the US Dollar Index.
So where now for the buck? The not very conclusive answer is, that depends.
We're not meaning to be coy. It’s simply that the Dollar Index is at a crossroad. The path it will follow now may determine its trajectory for the next weeks to months.

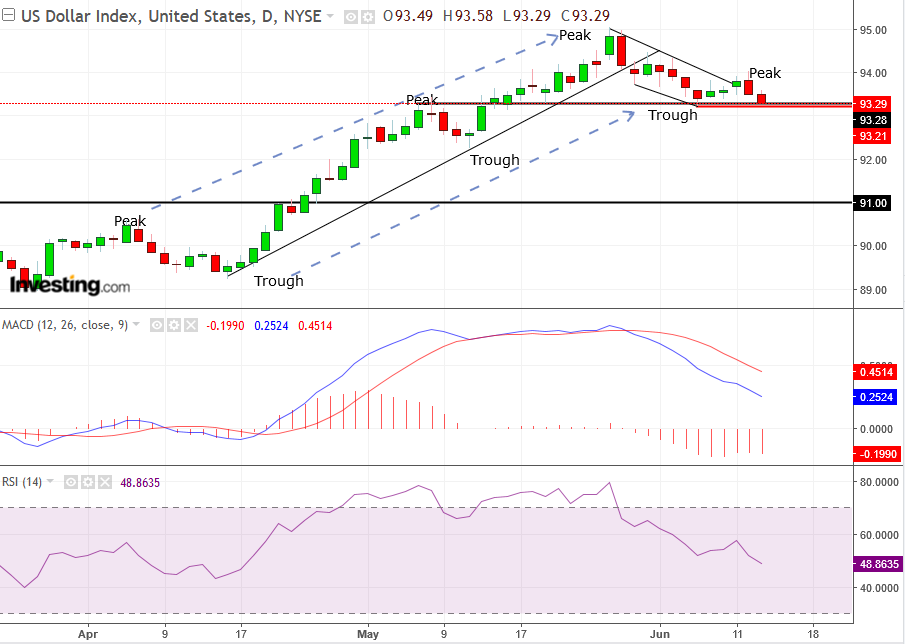
After bottoming from January-April, the Dollar Index has been trading in an up-channel, with a rising progression of peaks and troughs constituting an uptrend. The channel was broken in late May, but the peak and trough sequence—the official trend setter—remained intact, at least so far.
Indeed, the trading pattern since the channel break was potentially within a bullish, falling flag. However, Tuesday’s attempt at an upside breakout failed. Now the price is threatening to post a second, lower trough, after that of June 6, which was at 93.21. That would establish a downtrend, in which the momentum of supply is seen to overcome that of demand, pushing prices even lower.
As of now, the uptrend since April remains intact, but a downtrend is knocking on the door. At the same time, both the MACD and RSI have provided sell signals, demonstrating that both price and momentum are breaking down.
Trading Strategies
Conservative traders would wait for a lower trough to be posted, on a closing basis, followed by a correction that would successfully test the reversal when a long red candle would engulf a preceding green candle or a small candle of any color.
Moderate traders may wait for a close below the June 6, 93.21 low.
Aggressive traders may enter a long position now, with a stop-loss below the previous trough and a minimum target of the previous, June 12, $94.01 peak, hoping for a bounce off the support of the June 6 trough.
