
- IBM stock is up over 12% so far in 2021 and hit a multi-year high in June
- Big Blue reported weaker-than-expected Q3 earnings, raising eyebrows
- Despite potential short-term volatility, buy-and-hold investors could use any further short-term shares price decline as an opportune entry point
Investors in tech giant International Business Machines (NYSE:IBM) have seen their shares gain 12.1% year-to-date after hitting a multi-year high of $152.84 in June. But yesterday the stock slid 4% in extended trading after Big Blue missed revenue forecasts when it reported Q3 results. Quarterly revenue was up just 0.3% to $17.6 billion and adjusted earnings came in at $2.52 per share, down 2%.
However, when numbers for the company's Kyndryl, managed infrastructure business are excluded, revenue at IBM increased by 2.5%. In October, IBM’s board approved the spin-off of Kyndryl into a separate business. "Once distributed, each holder of IBM common stock will receive one share of Kyndryl common stock for every five shares of IBM common stock held on Oct. 25, 2021.”
This upcoming spin-off will enable a new IBM to emerge. Yet Wall Street is still debating if the move will be sufficient enough for management to make IBM viable in the competitive cloud market where Amazon (NASDAQ:AMZN) and Microsoft (NASDAQ:MSFT) have already made big inroads.

The 52-week range for shares of Big Blue has been $105.92 - $152.84, while the company’s market capitalization stands at $127.18 billion. As we write, the current price of $141.90 supports a dividend yield of 4.62%.
IBM, which was founded in 1911, has a storied history which includes both achievements and hurdles. In recent years, management has been working to expand its hybrid-cloud ecosystem and artificial intelligence (AI) solutions. The company's Q3 free cash flow stood at $0.6 billion. And, since year-end 2020, the company reduced debt by $7.0 billion.
During the earnings call, CEO Arvind Krishna said:
“We continue to make progress in our software and consulting businesses, which represent our higher growth opportunities… [W]e are confident in achieving our medium-term objectives of mid-single digit revenue growth and strong free cash flow generation.”
What To Expect From IBM Stock
Among 19 analysts polled via Investing.com, IBM stock has an ‘outperform' rating.
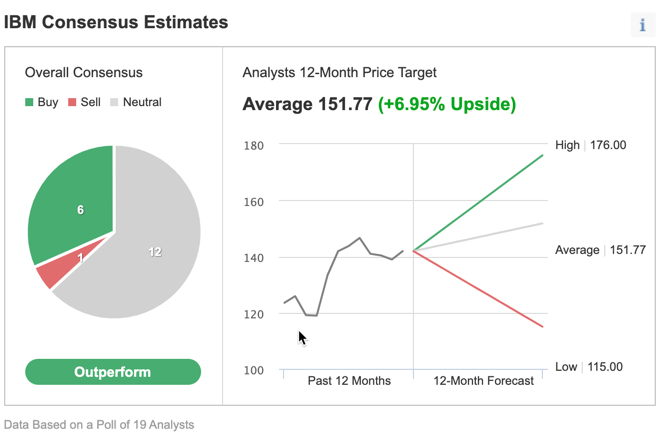
Source: Investing.com
The shares have a 12-month price target of $151.77, implying an increase of about 7% from current levels. The 12-month price range currently stands between $115 and $176.
Trailing P/E, P/S and P/B ratios for IBM stock stand at 24.53x, 1.71x and 5.8x, respectively. By comparison, these ratios for another tech heavyweight, Salesforce.com (NYSE:CRM), are 115.95x, 12.16x, and 5.15x. On the other hand, they are 24.99x, 5.65x, and 4.49x for Germany-headquartered SAP (NYSE:SAP).
Readers who watch technical charts might be interested to know that a number of IBM's short-term oscillators are cautioning investors. However, long-term “buy” signals are still intact.
Our expectation is for IBM stock to slide below the $135 level and toward $130, where it is likely to find initial support. If that level gets breached, than the next target would be $125, where there would be strong support. The shares then would likely trade sideways while establishing a new base.
3 Possible Trades On International Business Machines
1. Buy IBM Stock At Current Levels
Investors who are not concerned with daily moves in price and who believe in the long-term potential of the company could consider investing in International Business Machines stock now.
On Oct. 20, IBM stock closed at $141.90. It is likely that the shares will open lower on Oct. 21.
Buy-and-hold investors should expect to keep this long position for several months while the stock first makes an attempt at analysts’ price target of $151.77, returning 7% from the current level. Then, the next level to watch would be the recent multi-year high of $152.84. Investors should expect to hold this position for several months, if not multiple quarters.
Readers who plan to invest soon but are concerned about large declines might also consider placing a stop-loss at about 3-5% below their entry point.
2. Buy An ETF With IBM As A Main Holding
Many readers are familiar with the fact that we regularly cover exchange-traded funds (ETFs) that might be suitable for buy-and-hold investors. Thus, readers who do not want to commit capital to IBM stock but would still like to have substantial exposure to the shares could consider researching a fund that holds the company as a top holding.
Examples of such ETFs include:
- Invesco Dow Jones Industrial Average Dividend ETF (NYSE:DJD): This fund is up 16.6% YTD, and IBM stock’s weighting is 7.27%;
- Global Beta Smart Income ETF (NYSE:GBDV): The fund is up 20.6% YTD, and IBM stock’s weighting is 4.73%;
- Schwab U.S. Dividend Equity ETF™ (NYSE:SCHD): The fund is up 21.9% YTD, and IBM stock’s weighting is 4.16%;
- Capital Link NextGen Protocol ETF (NYSE:KOIN): The fund is up 19.1% YTD, and IBM stock’s weighting is 3.16%.
3. Bear Put Spread
Readers who believe there could be some profit-taking in IBM stock in the short run might consider initiating a bear put spread strategy. As it involves options, this set up will not be appropriate for all investors.
It might also be appropriate for long-term IBM investors to use this strategy in conjunction with their long stock position. The set-up would offer some short-term protection against a decline in price in the coming weeks.
This trade requires a trader to have one long IBM put with a higher strike price and one short IBM put with a lower strike price. Both puts will have the same expiration date.
Such a bear put spread would be established for a net debit (or net cost). It will profit if IBM shares decline in price. Let’s now look at an example with closing numbers from Oct. 20. When the market opens later today, these prices will be different. However, the method of risk/return calculation is the same.
For instance, the trader might buy an out-of-the-money (OTM) put option, like the IBM 21 January 2022 135-strike put option. This option is currently offered at $3.73. Thus, it would cost the trader $373 to own this put option, which expires in about three months.
At the same time, the trader would sell another put option with a lower strike, like the IBM Jan.21 125-strike put option. This option is currently offered at $1.61. Thus, the trader would receive $161 to sell this put option, which also expires in about three months.
The maximum risk of this trade would be equal to the cost of the put spread (plus commissions). In our example, the maximum loss would be ($3.73 -1.61) X 100 = $212.00 (plus commissions).
This maximum loss of $212 could easily be realized if the position is held to expiry and both IBM puts expire worthless. Both puts will expire worthless if the IBM share price at expiration is above the strike price of the long put (higher strike), which is $135 at this point.
This trade’s potential profit is limited to the difference between the strike prices (i.e., ($135.00 - $125.00) X 100) minus the net cost of the spread (i.e., $212.00) plus commissions.
In our example, the difference between the strike prices is $10.00. Therefore, the profit potential is $1,000 - $212 = $788.
This trade would break even at $132.88 on the day of the expiry (excluding brokerage commissions).