A great deal transpired across markets last week and after sifting through a few dozen charts this morning it’s clear that a major transition may be underway. My friend J.C. Parets (@allstarcharts) has been bullish on the USD/CAD currency pair for at least a year so when he came out with a post in which he adamantly shifted his bias I took notice. Here’s J.C.:
“I’m a weight-of-the-evidence guy. To me, the bearish implications here for USD/CAD (bullish for Canadian Dollar Futures) are very skewed in one direction. Price-wise this is a buy 100 times out of 100. The Commercial Hedgers, who we consider the smart money, are pretty much as long as they’ve ever been. Sentiment-wise, our data suggests that Canadian Dollars today are more hated then they have ever been (our data goes back 25 years). What more can you ask for?”
USD/CAD is particularly important in the current macro backdrop because it has in many ways become a proxy for the emerging markets/commodities unwind trade due to Canada’s position as a major commodities exporter and a hub for global commodities exploration firms.
Other noteworthy charts that support the idea that a major market transition could be underway:
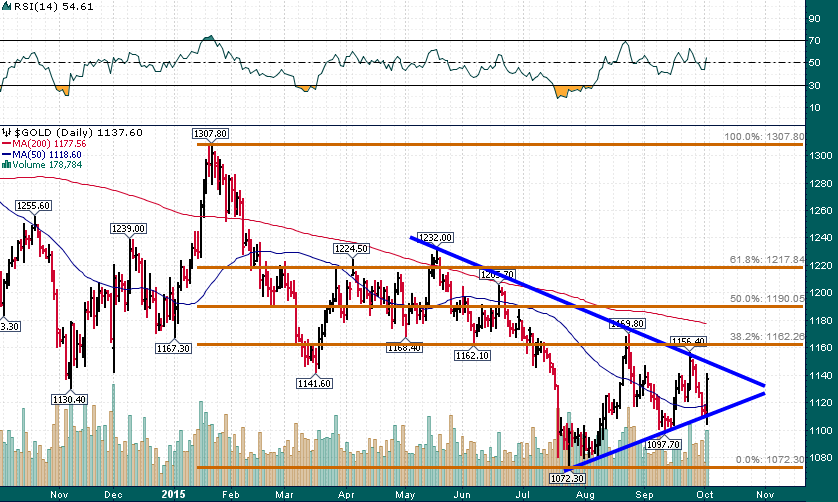
Gold continues to coil with a series of higher lows and lower highs. Friday’s session was particularly noteworthy given the failed breakdown below the trend line drawn from the July low and the ensuing powerful rally. An upside breakout from the symmetrical triangle would target a move up to at least the May highs near $1230/oz.
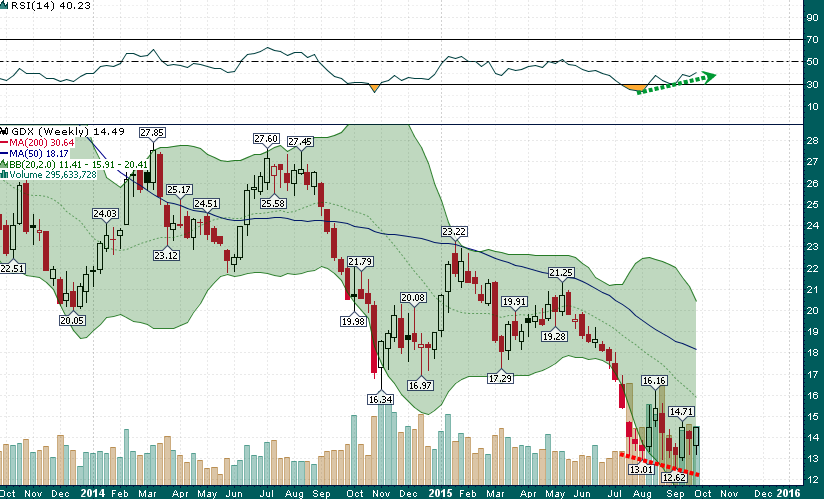
Market Vectors Gold Miners (NYSE:GDX) has printed bullish engulfing candlesticks 2 of the last 3 weeks and the most recent all-time low ($12.62) took place with a significant bullish momentum divergence.
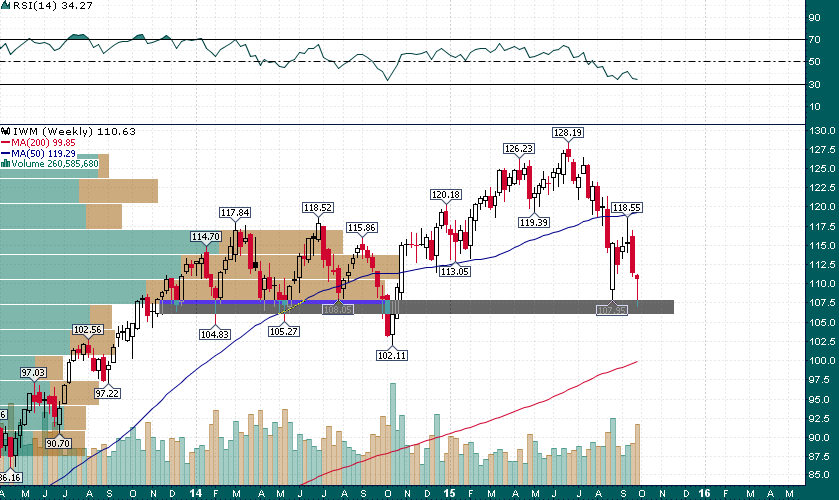
Small caps (via iShares Russell 2000 (NYSE:IWM)), which were the first segment of the market to begin the correction back in June, printed a bullish hammer candlestick on thick volume last week. The ~$107 support level held yet again and the makings of a double-bottom are in place.
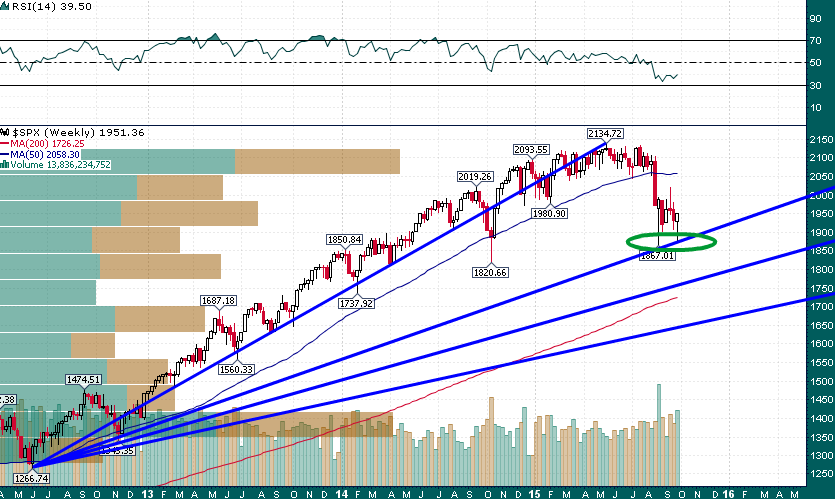
Double-bottom at important Fibonacci support level for the S&P 500?
The signs are all there. An end to the equity market correction, an imminent pullback in the US dollar, and a commodities rally (particularly in precious metals) after a grueling multi-year bear market. Perhaps most notable to me is the potential for a substantial and unexpected equity market rally given the bullish seasonal period we are now entering and the more than ample short covering fuel:
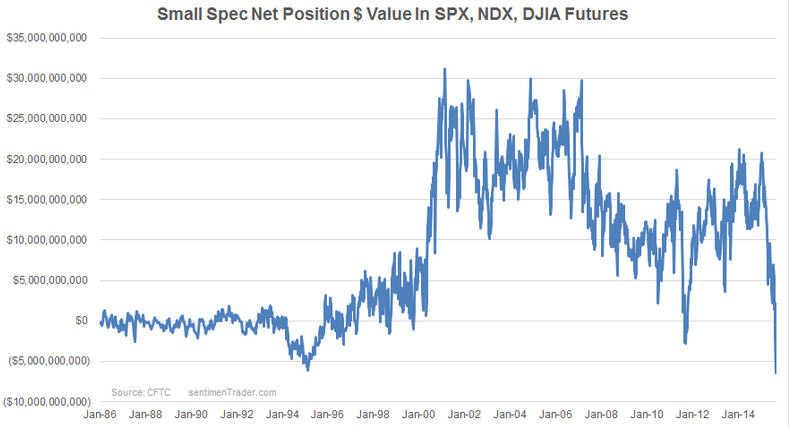
While this chart is 3 weeks old, speculative short positions in equity index futures (S&P 500, NDX, DJIA) remain very high by historical standards.
