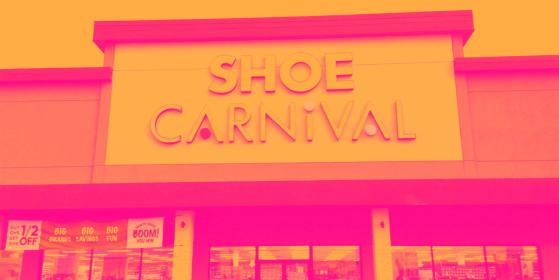
Quarterly earnings results are a good time to check in on a company’s progress, especially compared to its peers in the same sector. Today we are looking at Shoe Carnival (NYSE:CCL) (NASDAQ:SCVL) and the best and worst performers in the footwear retailer industry.
Footwear sales–like their apparel counterparts–are driven by seasons, trends, and innovation more so than absolute need and similarly face the bigger-picture secular trend of e-commerce penetration. Footwear plays a part in societal belonging, personal expression, and occasion, and retailers selling shoes recognize this. Therefore, they aim to balance selection, competitive prices, and the latest trends to attract consumers. Unlike their apparel counterparts, footwear retailers most sell popular third-party brands (as opposed to their own exclusive brands), which could mean less exclusivity of product but more nimbleness to pivot to what’s hot.
The 4 footwear retailer stocks we track reported a mixed Q2. As a group, revenues missed analysts’ consensus estimates by 1% while next quarter’s revenue guidance was in line.
The Fed cut its policy rate by 50bps (half a percent) in September 2024, the first in roughly four years. This marks the end of its most pointed inflation-busting campaign since the 1980s. While CPI (inflation) readings have been supportive lately, employment measures have bordered on worrisome. The markets will be assessing whether this rate cut's timing (and more potential ones in 2024 and 2025) is ideal for supporting the economy or a bit too late for a macro that has already cooled too much.
Luckily, footwear retailer stocks have performed well with share prices up 15.7% on average since the latest earnings results.
Shoe Carnival (NASDAQ:SCVL) Known for its playful atmosphere that features carnival elements, Shoe Carnival (NASDAQ:SCVL) is a retailer that sells footwear from mainstream brands for the entire family.
Shoe Carnival reported revenues of $332.7 million, up 12.9% year on year. This print fell short of analysts’ expectations by 1.1%. Overall, it was a slower quarter for the company with underwhelming earnings guidance for the full year.
“Customer engagement continued to exceed our expectations and sales momentum accelerated rapidly during our most important shopping event of the year, the Back-to-School season. We achieved a net sales record this quarter, surpassing all previous second quarter sales in our company’s history. Gross profit margin expanded versus prior year, we gained significant market share, and we delivered earnings above our guidance in the quarter,” said Mark Worden, President and Chief Executive Officer.
Shoe Carnival scored the fastest revenue growth but had the weakest full-year guidance update of the whole group. Unsurprisingly, the stock is up 17.9% since reporting and currently trades at $44.25.
Is now the time to buy Shoe Carnival? Find out by reading the original article on StockStory, it’s free.
Best Q2: Foot Locker (NYSE:NYSE:FL) Known for store associates whose uniforms resemble those of referees, Foot Locker (NYSE:FL) is a specialty retailer that sells athletic footwear, clothing, and accessories.
Foot Locker reported revenues of $1.9 billion, up 1.9% year on year, in line with analysts’ expectations. The business had a very strong quarter with an impressive beat of analysts’ earnings estimates and optimistic earnings guidance for the full year.
Although it had a fine quarter compared its peers, the market seems unhappy with the results as the stock is down 19.2% since reporting. It currently trades at $26.50.
Weakest Q2: Designer Brands (NYSE:NYSE:DBI) Founded in 1969 as a shoe importer and distributor, Designer Brands (NYSE:DBI) is an American discount retailer focused on footwear and accessories.
Designer Brands reported revenues of $771.9 million, down 2.6% year on year, falling short of analysts’ expectations by 5.4%. It was a disappointing quarter as it posted underwhelming earnings guidance for the full year and a miss of analysts’ earnings estimates.
Designer Brands delivered the weakest performance against analyst estimates and slowest revenue growth in the group. Interestingly, the stock is up 21.6% since the results and currently trades at $7.06.
Boot Barn (NYSE:NYSE:BOOT) With a strong store presence in Texas, California, Florida, and Oklahoma, Boot Barn (NYSE:BOOT) is a western-inspired apparel and footwear retailer.
Boot Barn reported revenues of $423.4 million, up 10.3% year on year. This number beat analysts’ expectations by 1.6%. Taking a step back, it was a mixed quarter as it also recorded a solid beat of analysts’ earnings estimates but underwhelming earnings guidance for the next quarter.
Boot Barn delivered the biggest analyst estimates beat and highest full-year guidance raise among its peers. The stock is up 42.5% since reporting and currently trades at $165.08.
This content was originally published on Stock Story

