Breaking Down the January 2022 CPI and Other Economic Reports
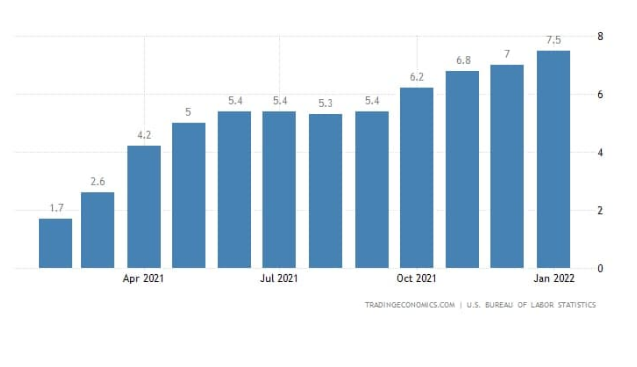
US Consumer Price Index (CPI) Inflation hit 7.5% in January 2022, the highest in 40 years. CPI is one of two inflation figures that the U.S. Bureau of Labor Statistics (BLS) reports each month.
In this blog, we will cover three related elements of the US economy:
- Inflation
- Unemployment
- GDP
But first, I am going to share some dirty secrets they don’t want you to know about regarding data and numbers and how they get used in today’s world.
Two Secrets to Cut Through the BS:
One thing I love to do in life is to explain complex economic concepts in a simple way so normal folks can understand them easily and not get fooled.
Later, in this blog, I review the latest US inflation report as well as other economic data and break it down.
When you hear contrary statements such as “red-hot inflation causes economic troubles” and “economic growth like we’ve never seen before” you might get confused. It can be hard to tell what’s true and what’s not.
Is this economy the best thing we’ve ever seen? Or is it a total disaster? Am I just too stupid to understand economics? The answer to that question is NO!
Like other subjects, economics is simple when you go back to basics. Economics can also be made to sound complicated and scary on purpose, so that readers or listeners don’t question what doesn’t make any sense to them. This could be done by those with a political advantage to gain.
It might seem that you need a university degree to understand economics, and a few with an economics degree can use fancy words to confuse and manipulate others. My goal is to help you know enough so it’s harder for anyone to fool you.
To help you in making up your own mind on the subject of the current economy I will also share a few secrets with you.
Secret #1: Data can only be Measured by Comparing it to Other Data
You see numbers posted online on many subjects. The writer (including me) or organization plans to paint a little picture in your head with numbers.
While these may be factual, it is hard to really tell what’s going on with the numbers unless you compare them with other numbers.
For example, if you are a baseball fan, and someone tells you this ball player is amazing and had a .360 batting average (36% hits per at bat), you know that’s really good. If you don’t follow baseball, the number to compare it to would be the 2021 batting champion in baseball who hit .328 (32.8% hits per at bat).
Now if you go and see that they played a full season, you could argue that they are the best batter in baseball right now. If you go and look and see that they played in 15 games (under 10% of his team’s games), you probably wouldn’t make that argument.
Another example is your child coming home from school. You probably are familiar with the grading system of letters and numbers. They tell you they got a 95 grade, that sounds great. Now let’s just say their school changed the numbers and instead of the max being 100 the max score is now 200. A score of 95 would mean 47.5% of the answers right and a terrible score.
Data matters, but it also matters what data it is compared to.
Secret #2: Data Often Has a Slant
All humans I have ever met have different points of view and even slightly different opinions. And all data you see posted online has been “cooked” by human hands to some degree.
To solve this, I do my best to try to find data which is as “uncooked” as possible. There are no absolutes, but the original source of data would be less “cooked” than an article describing the data.
All news agencies have an editorial policy. All podcasters and bloggers have a message they want to communicate and they see the world through their own lens. Some try their best to be impartial. Some communicate their opinions about situations very strongly with an intent to change other’s minds.
Politicians will use numbers that make them look good and make their opponents look bad. Salespeople will use figures that will support the pain point they use in their sales pitch to get closes.
There is nothing particularly wrong with that, as long as you understand what is happening. All writers and content creators have a slant, including me.
Ok, so now let’s look at the US economy.
Inflation
As mentioned above, the CPI inflation report measures how much it costs people living in cities across the US to buy things. It comes out monthly from the Bureau of Labor Statistics.
- Inflation is usually reported year-over-year, so this means that the price of things measured in the report are 7.5% higher than January in 2021. It was also up 0.6% over December 2021.
- Food is up 7%.
- Energy is up 27%.
- Core inflation (that means not counting food and energy) is up 6%.
Here are the inflation figures for the past twelve months:

US CPI Inflation. Courtesy of TradingEconomics.com
Unemployment & Job Growth
This tweet from US President Joe Biden couldn’t be more assertive as a positive. And while it’s technically true, it does not take into account how COVID-19 lockdowns affected the economy or what percentage of people are unemployed.
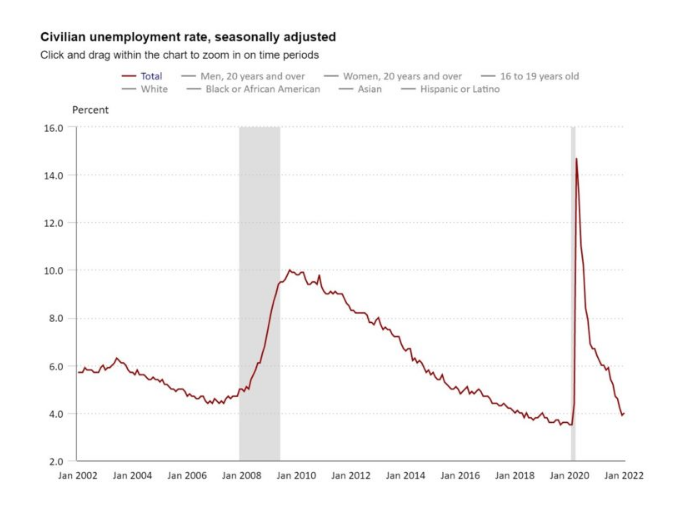
Let’s look at a graph showing this.

Civilian Unemployment Rate — Courtesy of U.S. Bureau of Labor Statistics
Here are some more numbers:
- Unemployment was at 3.5% in February 2020 before COVID-19.
- Unemployment hit a peak of 14.7% in April 2020.
- Unemployment was at 6.4% in January 2021.
- Unemployment went up to 4.0% in January 2022 from 3.9% in December 2021.
Let’s look at Black and Latino numbers:
- Hispanic/Latino unemployment was at 4.3% in February 2020, 8.6% in January 2021 and 4.9% in January 2022.
- Black unemployment was at 6.0% in February 2020, 9.2% in January 2021, and 6.9% in January 2022.
So, in other words, the economy is slowly re-opening from COVID-19, and unemployment numbers are still 14% worse than before lockdowns started, pretty evenly affecting all concerned.
GDP
The above tweet by Biden covers the annual U.S. Real GDP. It’s called “real” because it deducts the number against inflation of the US dollar. The numbers he states are completely factual — but doesn’t mention COVID-19 and the economy closing down then re-opening. This event affected the last U.S. economy of the current and previous administration.
Gross domestic product, or GDP, is the total monetary or market value of all the finished goods and services produced within a country’s borders, according to Investopedia.
An excellent source for raw data on the GDP and other US economic figures is this website.
To put the figures into perspective, here is the real GDP growth broken down for a few years:
- 2016: 1.6% (last year of Obama admin)
- 2017: 2.3% (first year of Trump admin)
- 2018: 2.9%
- 2019: 2.4%
- 2020: -3.4% (COVID/last year of Trump admin)
- 2021: 5.6%
If one discounted 2020 and instead compared 2021 to 2019 you will see 2021 GDP was 2.1% over 2019, less than every year of the previous administration before COVID.
Here is the link to get the exact figures I used for my calculations.
Again, COVID-19 DID happen, so this is just another look at the data.
The US economy did in fact grow in 2021 as people went back to work and Federal government spending was directed into the economy, though not as spectacular as Biden put it.
Now you may wonder, is there a way to see if the economy is now better for the average American? Or more specifically is there a number, graph or data source that shows this?
The answer is yes, it is called real wage growth.
Real Wage Growth
“Real Wage Growth” measures how much wages go up and down over previous periods matched with inflation. In other words, if your wages are up 5% but inflation is 10% you have less buying power, not more. If your wages go up 4% and inflation is up 2% you have more buying power.
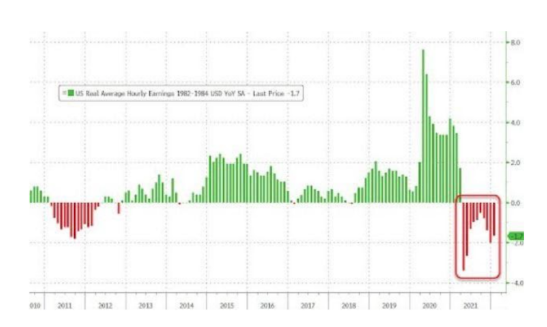
Here is a graph provided by Zero Hedge’s Twitter (NYSE:TWTR) account. For full disclosure, this a right-wing economics website which is not shy about its slant, a less-than positive view of the Biden administration’s handling of the economy.

Here is the full report on the real earnings from the BLS.
For 10 consecutives months, real wage growth has been negative, when measured against the same month of the previous year. It was -1.7% in January 2022, versus January 2021. Real wage growth In January was +0.1% versus December 2021.
In comparison, there have been three negative months for real wage growth in the previous eight years.
In Part Two I will dive into my greatest fear about the US economy and why it is tied to the energy sector’s 27% inflation.
This article was originally published on https://thelatestblock.com/
