December started on a high note for many US stocks as the S&P 500 index hit an all-time high on the first day of the month. Year-to-date (YTD), the index is up close to 14%. Similarly, the SPDR S&P 500 (NYSE:SPY), an exchange-traded fund (ETF) based on the index, is also up close to 14% and made an all-time high on Dec.1.
Since the record number of the first day of the month, we have seen some consolidation and profit-taking in the S&P 500. Investors now wonder if the historic rally could pause in the weeks to come. Thus they are looking for ways to limit their risks.
Previously, we introduced several ETFs for mitigating downside risks. They included funds for hedging short-term volatility}}, covered calls, multi-asset ETFs, inverse ETFs, an ETF with a basket of out-of-the-money (OTM) put options on the S&P 500 index and {{art-200542656||buffered ETFs.
Today, we extend the discussion to another fund. It is, however, important to remind Investing.com readers that the Street offers no free lunches. Each strategy comes with a unique set of constraints, advantages and disadvantages.
Although such ETFs may help prevent large losses, they may also cap gains. Therefore, potential investors need to research the suitability of each fund for their portfolios.
Some of these funds may also rely on proprietary quantitative equity (or asset) selection strategies, which may not always be fully clear to potential investors or appropriate in all market conditions.
With that information, here is our ETF.
AGFiQ US Market Neutral Anti-Beta Fund
- Current price: $18.97
- 52-week range: $18.46 - $27.95
- Dividend yield: 1.02%
- Expense ratio: 0.45%
The AGFiQ US Market Neutral Anti-Beta Fund (NYSE:BTAL) provides exposure to the spread return between low and high beta stocks. A stock’s beta (β) typically measures the fluctuations of that stock to changes in the broader stock market.
A stock with a beta greater than 1 is more volatile than the overall market. Most tech stocks have betas higher than 1. If a stock’s beta is less than 1, then it is considered less volatile than the market. For example, utility stocks have betas lower than 1.

Fund managers invest equal dollar amounts in equally-weighted long low beta positions and equally weighted short high beta positions within each sector. Thus it is sector neutral.
The ETF is called market neutral as it has the potential to appreciate (or lose value) in any market (i.e., irrespective of the direction of broader indices).
BTAL has 200 long and 200 short positions. Thus, it is similar in principle to two long/short equity funds we discussed earlier in the week. The average beta for long and short positions are 0.84 and 1.44, respectively. As the performance of the fund is a function of the rates of return of the long and short positions, the “spread return” becomes the fund’s return.
The ETF tracks the Dow Jones U.S. Thematic Market Neutral Anti-Beta Index. It started trading in Sept. 2011 and net assets are over $210 million.
Several of the names the fund is currently long are:
- Booz Allen Hamilton (NYSE:BAH) (YTD, change: up 24.5%; beta: 0.81)
- Domino's Pizza (NYSE:DPZ) (YTD change: up 29.9%; beta: 0.39)
- Extra Space Storage (NYSE:EXR) (YTD change: up 5.5%; beta: 0.18)
- Fortinet (NASDAQ:FTNT) (YTD change: up 15.1%; beta: 1.06)
- Verizon Communication (NYSE:VZ) (YTD change: up 0.1%; beta: 0.41)
Similarly, a few of the names the ETF is currently short include:
- Applied Materials (NASDAQ:AMAT) (YTD change: up 39.7%; beta: 1.48)
- Boeing (NYSE:BA) (YTD change: down 31.28%; beta 1.67)
- Carnival (NYSE:CUK) (YTD change: down 58.4%; beta 2.21)
- Intuitive Surgical (NASDAQ:ISRG) (YTD change: up 27.9%; beta 0.96)
- Square Inc (NYSE:SQ)) (YTD change: up 222.9%; beta 2.73)
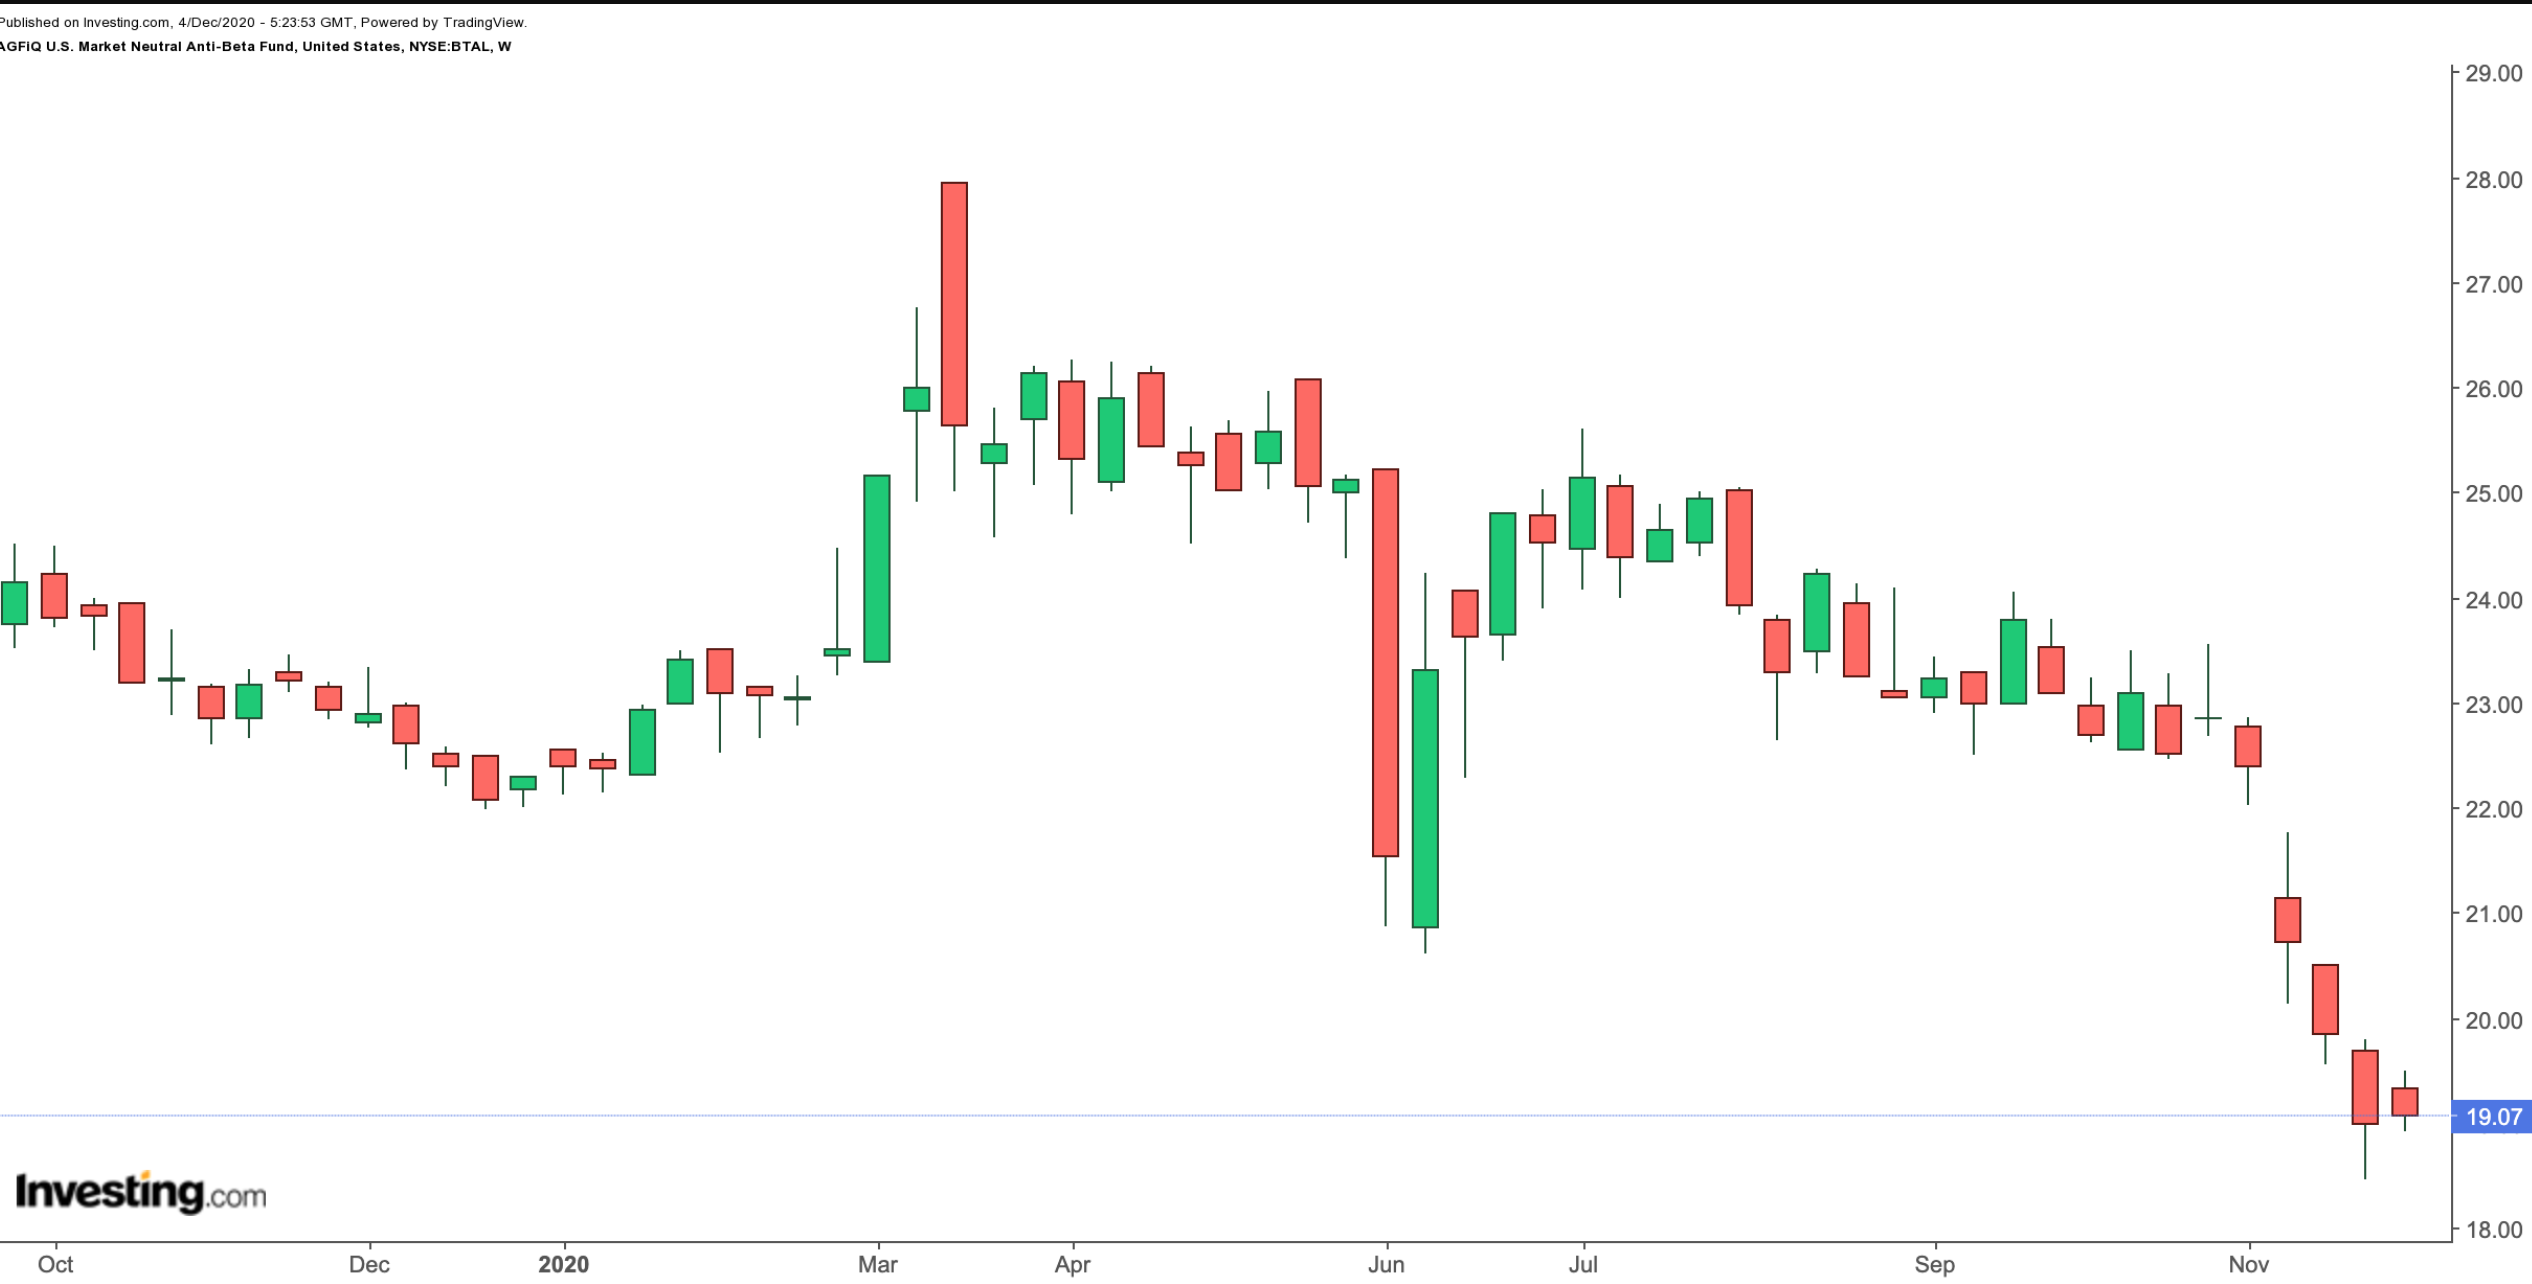
Readers who take the time to do a stock by stock review would note that quite a number of the high-beta shares the fund has sold have had robust positive returns in 2020. Put another way, they have not decreased in value, but instead some of them have seen new 52-week or even record highs.
As a result, the fund annual performance has not met the potential investment objectives of generating positive returns and reducing overall portfolio risk. YTD, BTAL is down around 14%, hovering at multi-year lows.
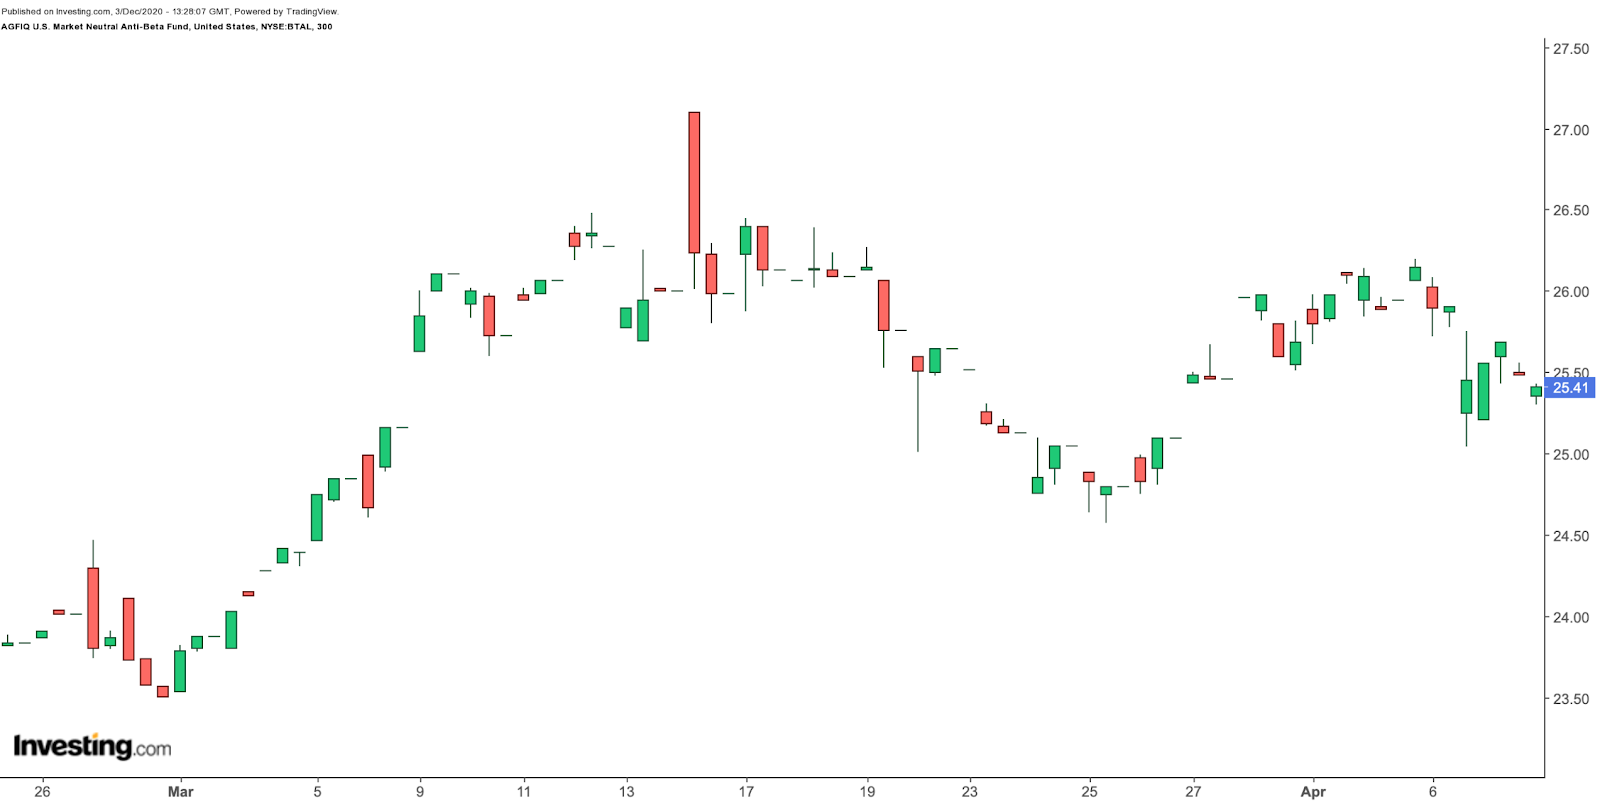
However, if you look at a snapshot of BTAL’s chart earlier in March, especially around the time when most market indices went into a free-fall, the performance of BTAL was quite different.

On Mar. 16, the fund made an all-time high. On the other hand, the S&P 500 index made a 52-week low on Mar. 23. Since then, the two have moved in opposite directions.
In the case of a future market decline, especially in prices of high-beta shares, the ETF could easily make a significant leg up. Typically, when markets sell off and volatility increases, high-beta stocks tend to decline more than low-beta stocks.
Timing market declines has historically been difficult, especially for retail investors. Thus having some exposure to BTAL, or a similar fund, may be an appropriate diversification strategy for a range of market participants.
