This post was written exclusively for Investing.com
Stocks have been rocketing higher since reaching the lows of late March. Based on the percentage of stocks above their 50-day moving average, it seems as if nearly every stock in the S&P 500 has risen sharply. As of June 4, about 95% of stocks in the index have topped their 50-day moving average. It is one of the highest levels on record, certainly within the last decade.
However, the number of stocks above their 200-day moving average tells a different tale—a story of many equities that still have a long way to recover from their March lows. The divergence of the two measures primarily reflect a momentum-driven market - one that fell very quickly and has improved just as fast. However, it does not speak to how sustainable the recovery will be. For a longer-term, more protracted recovery, it is the number of stocks above their 200-day moving average that needs to increase.
Momentum Driven Recovery
The number of stocks above their 50-day moving average has risen sharply, to some of the highest levels we have seen in a very long time. It would suggest that the pace of the stock market recovery has been fierce. But also know that it is coming off a very low level, falling to nearly 0% at their trough in March, indicating very oversold conditions. Because stocks sold off so quickly, this moving average fell at an equally rapid pace.

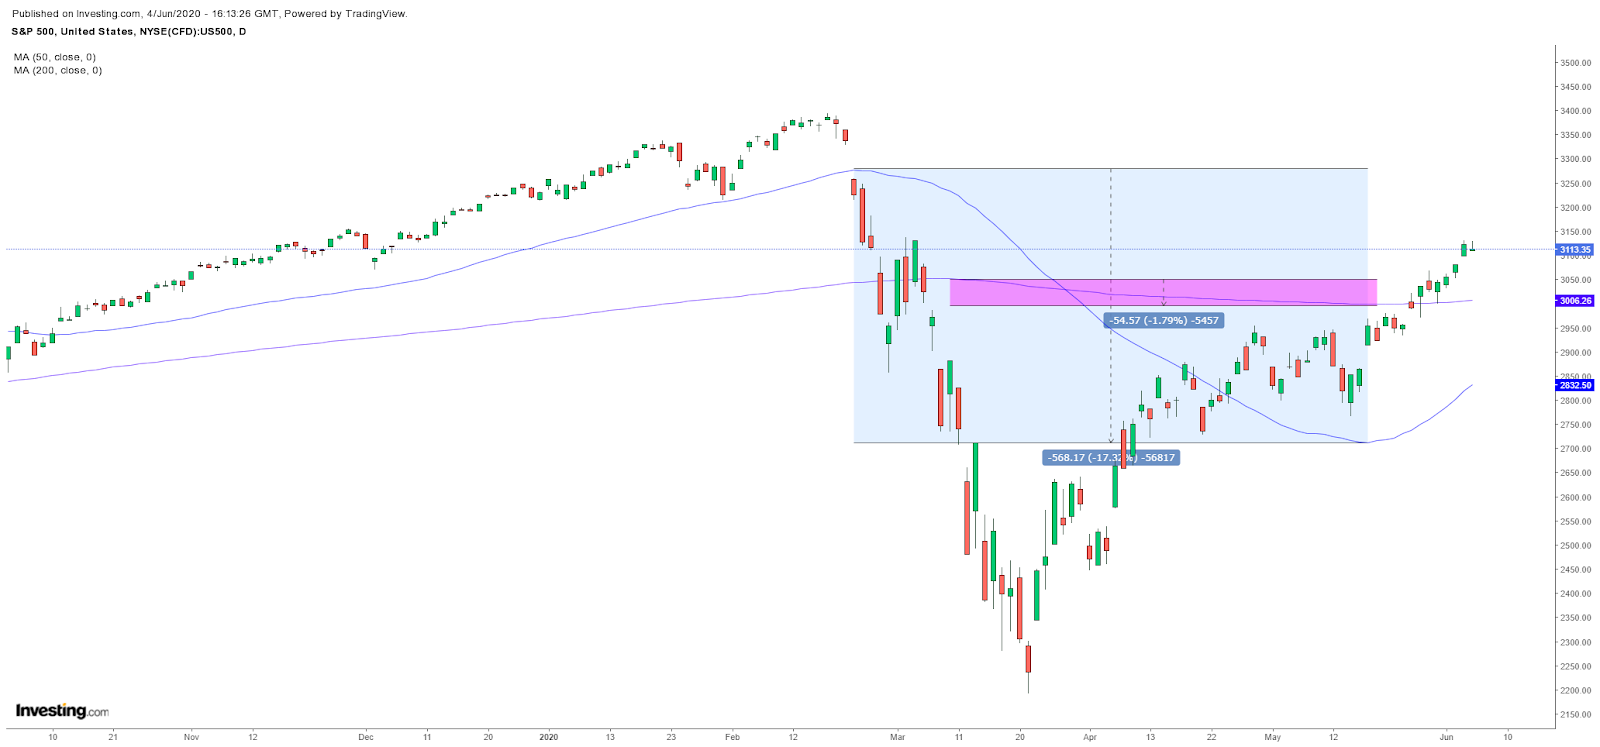
(Chart: TradingView)
For example, the 50-day moving average for the S&P 500 itself fell a stunning 17% from peak to trough between February 26 and May 18. By comparison, the 200-day moving average for the S&P 500 fell by just 1.8% over that same time. The hurdle to clearing the 50-day moving average for most stocks was far more manageable.
Something More Sustainable

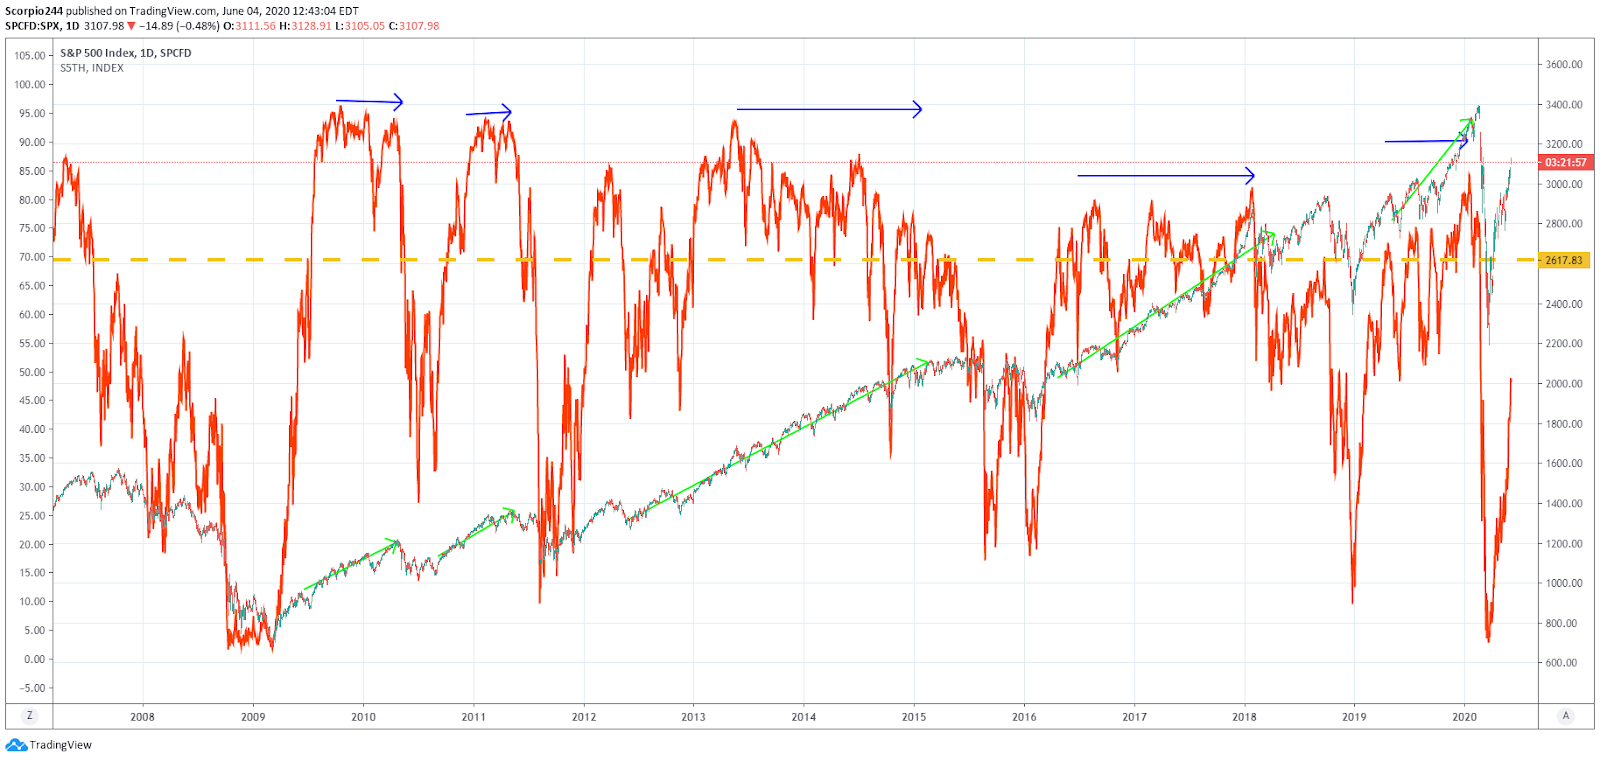
(Chart: Tradingview)
It makes focusing on the number of stocks above their 200-day moving average a better metric to gauge the health of an equity market rally or free-fall. Looking further back to some of the years following the recession of 2009, the number of stocks above their 200-day moving average rose above 70%. It, in many cases, created very long periods of stock market gains.
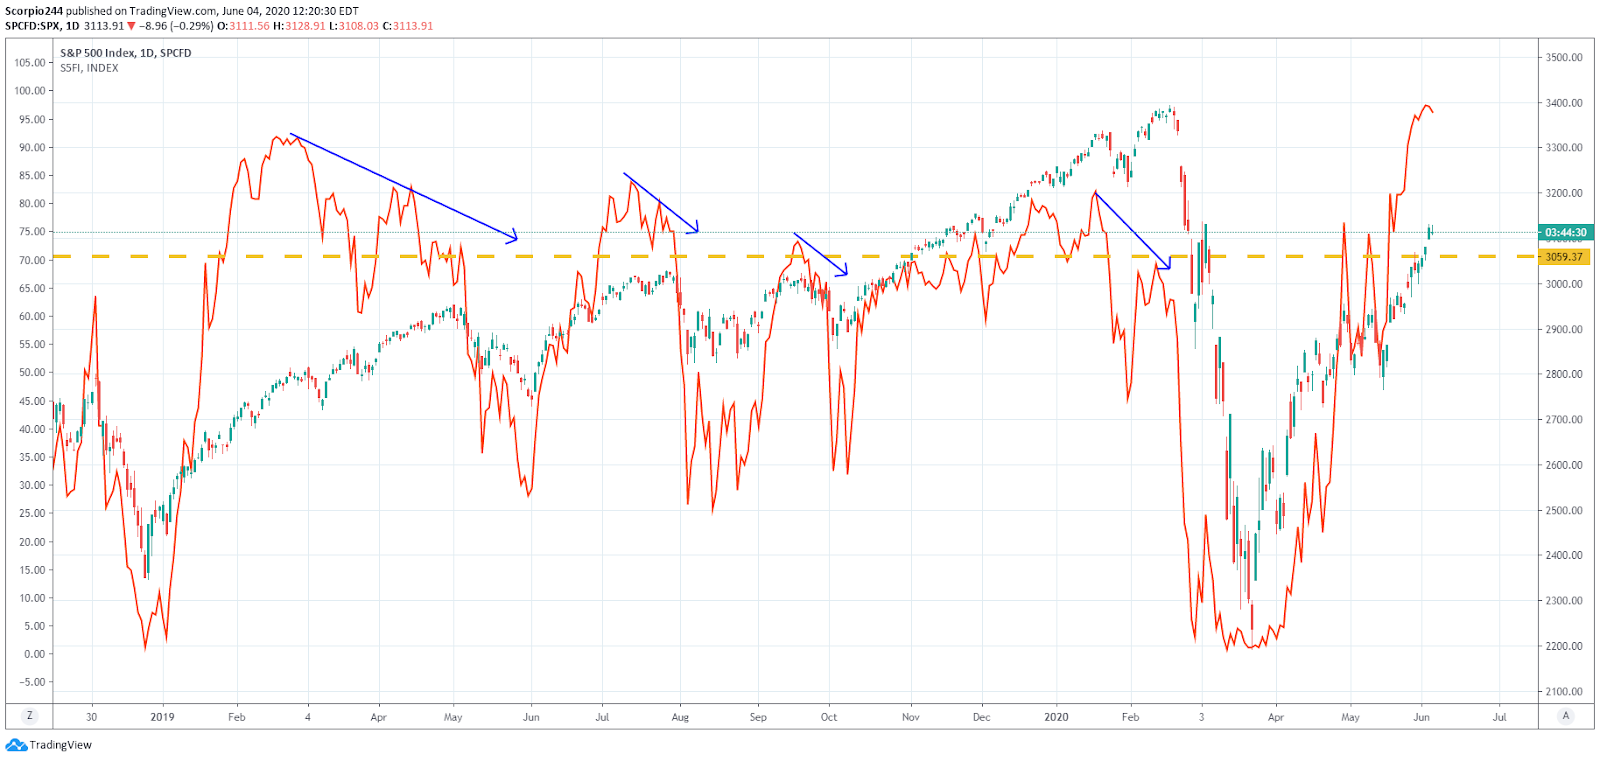
If anything, the number of stocks above the 50-day moving average seems to be better at predicting changes in short-term market trends. It has done a reasonably good job of helping to mark both market tops and bottoms. With the massive push higher, the current reading on the 50-day moving average may be signaling that the S&P 500 is currently overbought, and is more than likely due for a pullback. Just since 2018, the number of stocks above their 50-day average that rose above 70% and began to trend lower, generally led to a drop in the S&P 500.

(Chart: Tradingview)
Overall, it seems that for now, there have been many stocks that have benefited from the stock market rally. However, it appears at least based on the one indicator, the number of stocks above their 50-day moving average, there may be a breather that is coming. Meanwhile, the stocks above their 200-day moving average have a lot of work that still needs to be done before we are likely to see a longer-term sustainable rally in the equity markets.
