In this Berachain (BERA) price prediction 2025, 2026-2030, we will analyze the price patterns of BERA by using accurate trader-friendly technical analysis indicators and predict the future movement of the cryptocurrency.
Berachain (BERA) Current Market Status
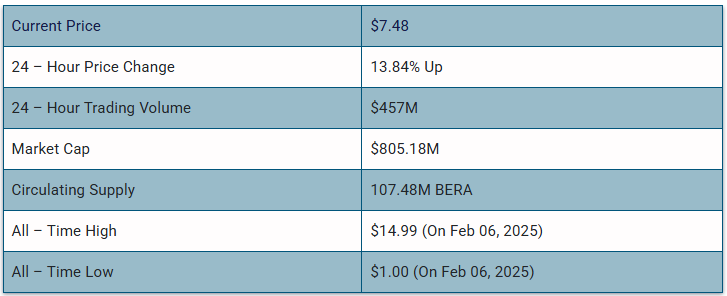
What is Berachain (BERA)

Berachain is an innovative blockchain network that operates on a tri-token model and uses the Proof-of-Liquidity (PoL) consensus mechanism. This model ensures a balanced ecosystem by incentivizing users to provide liquidity while still enabling them to participate in DeFi applications. The platform is EVM-compatible, allowing developers to easily migrate and build decentralized applications (dApps) on it.
Berachain officially launched its mainnet on February 5, 2025, alongside its Token Generation Event (TGE), marking a major step for the project. The pre-launch phase saw Berachain’s vaults attracting over $3.3 billion in deposits, showcasing strong early adoption. The blockchain, built on the Cosmos SDK, features a tri-token system: BERA (used for transactions and fees), BGT (a governance token for liquidity providers), and HONEY (a stablecoin for collateral-backed transactions).
Shortly after the mainnet release, BERA tokens were made available for trading on major platforms like Binance, Bybit, MEXC, and KuCoin. Additionally, Binance launched its HODLer Airdrops program, offering rewards to users who staked BNB. BERA also follows an inflationary model, increasing its supply by 10% annually, designed to encourage sustainable growth over time.
Berachain (BERA) 24H Technicals
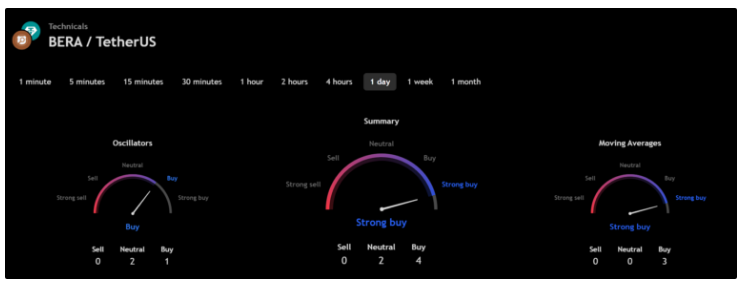
(Source: TradingView)
Berachain (BERA) Price Prediction 2025
Berachain (BERA) ranks 86th on CoinMarketCap in terms of its market capitalization. The overview of the Berachain price prediction for 2025 is explained below with a daily time frame.
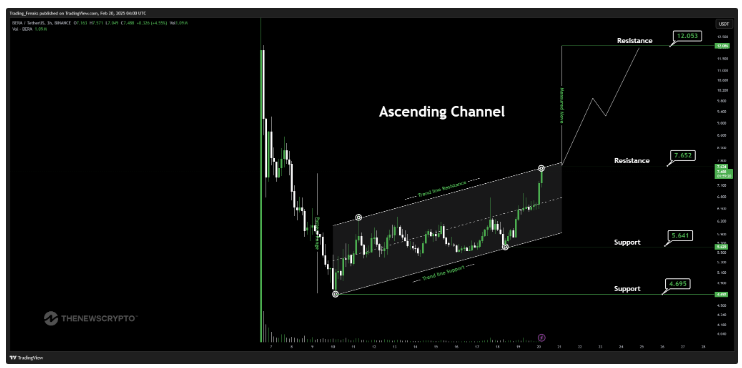
BERA/USDT Ascending Channel Pattern (Source: TradingView)
In the above chart, Berachain (BERA) laid out an ascending channel pattern. An ascending channel is the price action contained between upward-sloping parallel lines. Higher highs and higher lows characterize this price pattern. An ascending channel is used to show an uptrend in a security’s price. Ascending channels are short-term bullish in that a stock moves higher within an ascending channel, but these patterns often form within longer-term downtrends as continuation patterns.
At the time of analysis, Berachain (BERA) ‘s price was $7.48. If the pattern trend continues, then the price of BERA might reach the resistance levels of $7.652 and $12.053. If the trend reverses, then the price of BERA may fall to the support of $5.641, and $4.695.
Berachain (BERA) Resistance and Support Levels
The chart given below elucidates the possible resistance and support levels of Berachain (BERA) in 2025.
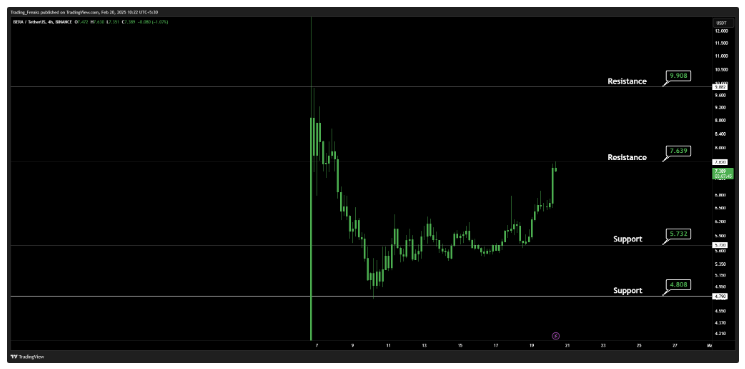
BERA/USDT Resistance and Support Levels (Source: TradingView)
From the above chart, we can analyze and identify the following as resistance and support levels of Berachain (BERA) for 2025.

BERA Resistance & Support Levels
Berachain (BERA) Price Prediction 2025 — RVOL, MA, and RSI
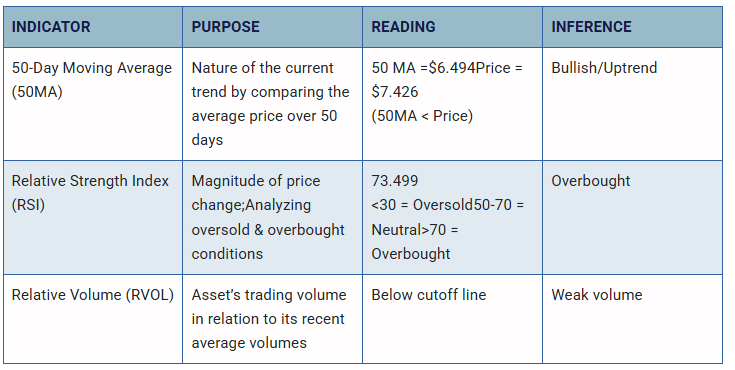
The technical analysis indicators such as Relative Volume (RVOL), Moving Average (MA), and Relative Strength Index (RSI) of Berachain (BERA) are shown in the chart below.
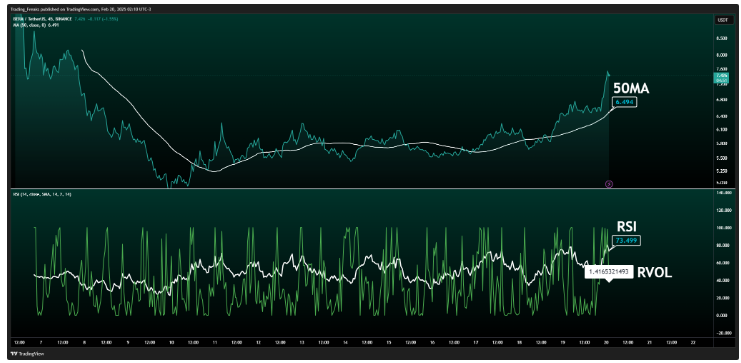
BERA/USDT RVOL, MA, RSI (Source: TradingView)
From the readings on the chart above, we can make the following inferences regarding the current Berachain (BERA) market in 2025.
Berachain (BERA) Price Prediction 2025 — ADX, RVI
In the below chart, we analyze the strength and volatility of Berachain (BERA) using the following technical analysis indicators — Average Directional Index (ADX) and Relative Volatility Index (RVI).
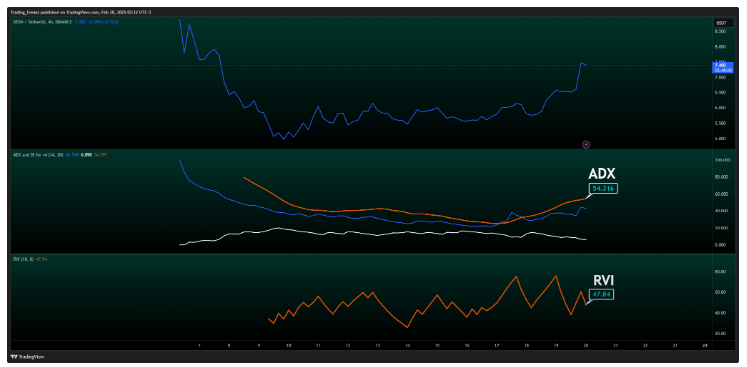
BERA/USDT ADX, RVI (Source: TradingView)
From the readings on the chart above, we can make the following inferences regarding the price momentum of Berachain (BERA).

Comparison of BERA with BTC, ETH
Let us now compare the price movements of Berachain (BERA) with that of Bitcoin (BTC), and Ethereum (ETH).
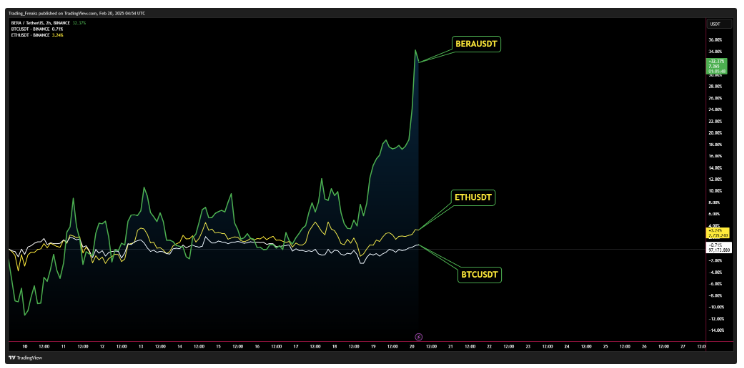
BTC Vs ETH Vs BERA Price Comparison (Source: TradingView)
From the above chart, we can interpret that the price action of BERA is similar to that of BTC and ETH. That is, when the price of BTC and ETH increases or decreases, the price of BERA also increases or decreases respectively.
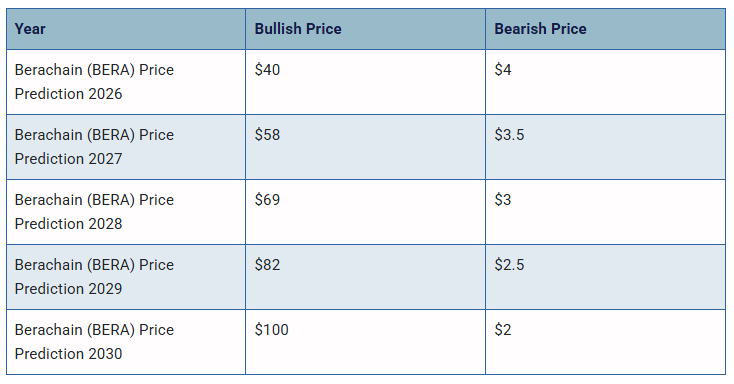
Berachain (BERA) Price Prediction 2026, 2027 – 2030
With the help of the aforementioned technical analysis indicators and trend patterns, let us predict the price of Berachain (BERA) between 2026, 2027, 2028, 2029 and 2030.
Conclusion
If Berachain (BERA) establishes itself as a good investment in 2025, this year would be favorable to the cryptocurrency. In conclusion, the bullish Berachain (BERA) price prediction for 2025 is $9.908. Comparatively, if unfavorable sentiment is triggered, the bearish Berachain (BERA) price prediction for 2025 is $4.808.
If the market momentum and investors’ sentiment positively elevates, then Berachain (BERA) might hit $20. Furthermore, with future upgrades and advancements in the Berachain ecosystem, BERA might surpass its current all-time high (ATH) of $14.99 and mark its new ATH.
This content was originally published by our partners at The News Crypto.
