-
Last week's market turmoil led Bitcoin and Ethereum to break below key support levels, turning those into resistance zones.
-
Bitcoin faces resistance at $61,000-$62,000, with potential for further gains if economic data aligns with expectations.
-
Ethereum struggles below $2,700, needing a break above $2,800 to continue its recovery.
Last week's market turmoil, triggered by a combination of factors including Japan's surprise interest rate hike and growing recession fears, sent shockwaves through the cryptocurrency market.
Bitcoin and Ethereum, the two largest cryptocurrencies, plunged below key support levels that had held for months, turning those zones into critical resistance.
As volatility spiked, both cryptocurrencies tested price levels last seen in the first months of the year. However, buying at the lows prevented a deeper decline.
By the start of the new week, trading activity has begun to stabilize, but the crypto market remains on edge.
Despite last week's sharp reversal, Bitcoin and Ethereum have yet to reclaim key support levels and continue to trade below a short-term downtrend.
Market participants are now eyeing this week’s economic data, especially inflation and retail sales figures, which could significantly influence global markets.
The Bank of Japan’s signals of a gradual approach to tightening helped ease tensions, but the crypto market’s recovery remains sluggish amid ongoing uncertainty.
As the Fed's September meeting approaches, the focus has shifted to how many times and to what extent rate cuts will occur this year.
If the upcoming data aligns with expectations, it could stabilize markets and reduce recession fears, potentially boosting risk appetite. However, any data falling short of expectations could reignite recession concerns and weigh on sentiment.
In summary, markets are likely to remain data-driven and volatile until the interest rate outlook for September becomes clearer.
With this backdrop, let's take a look at the technical situation for Bitcoin and Ethereum.
Bitcoin: Recovery Faces Key Resistance Levels
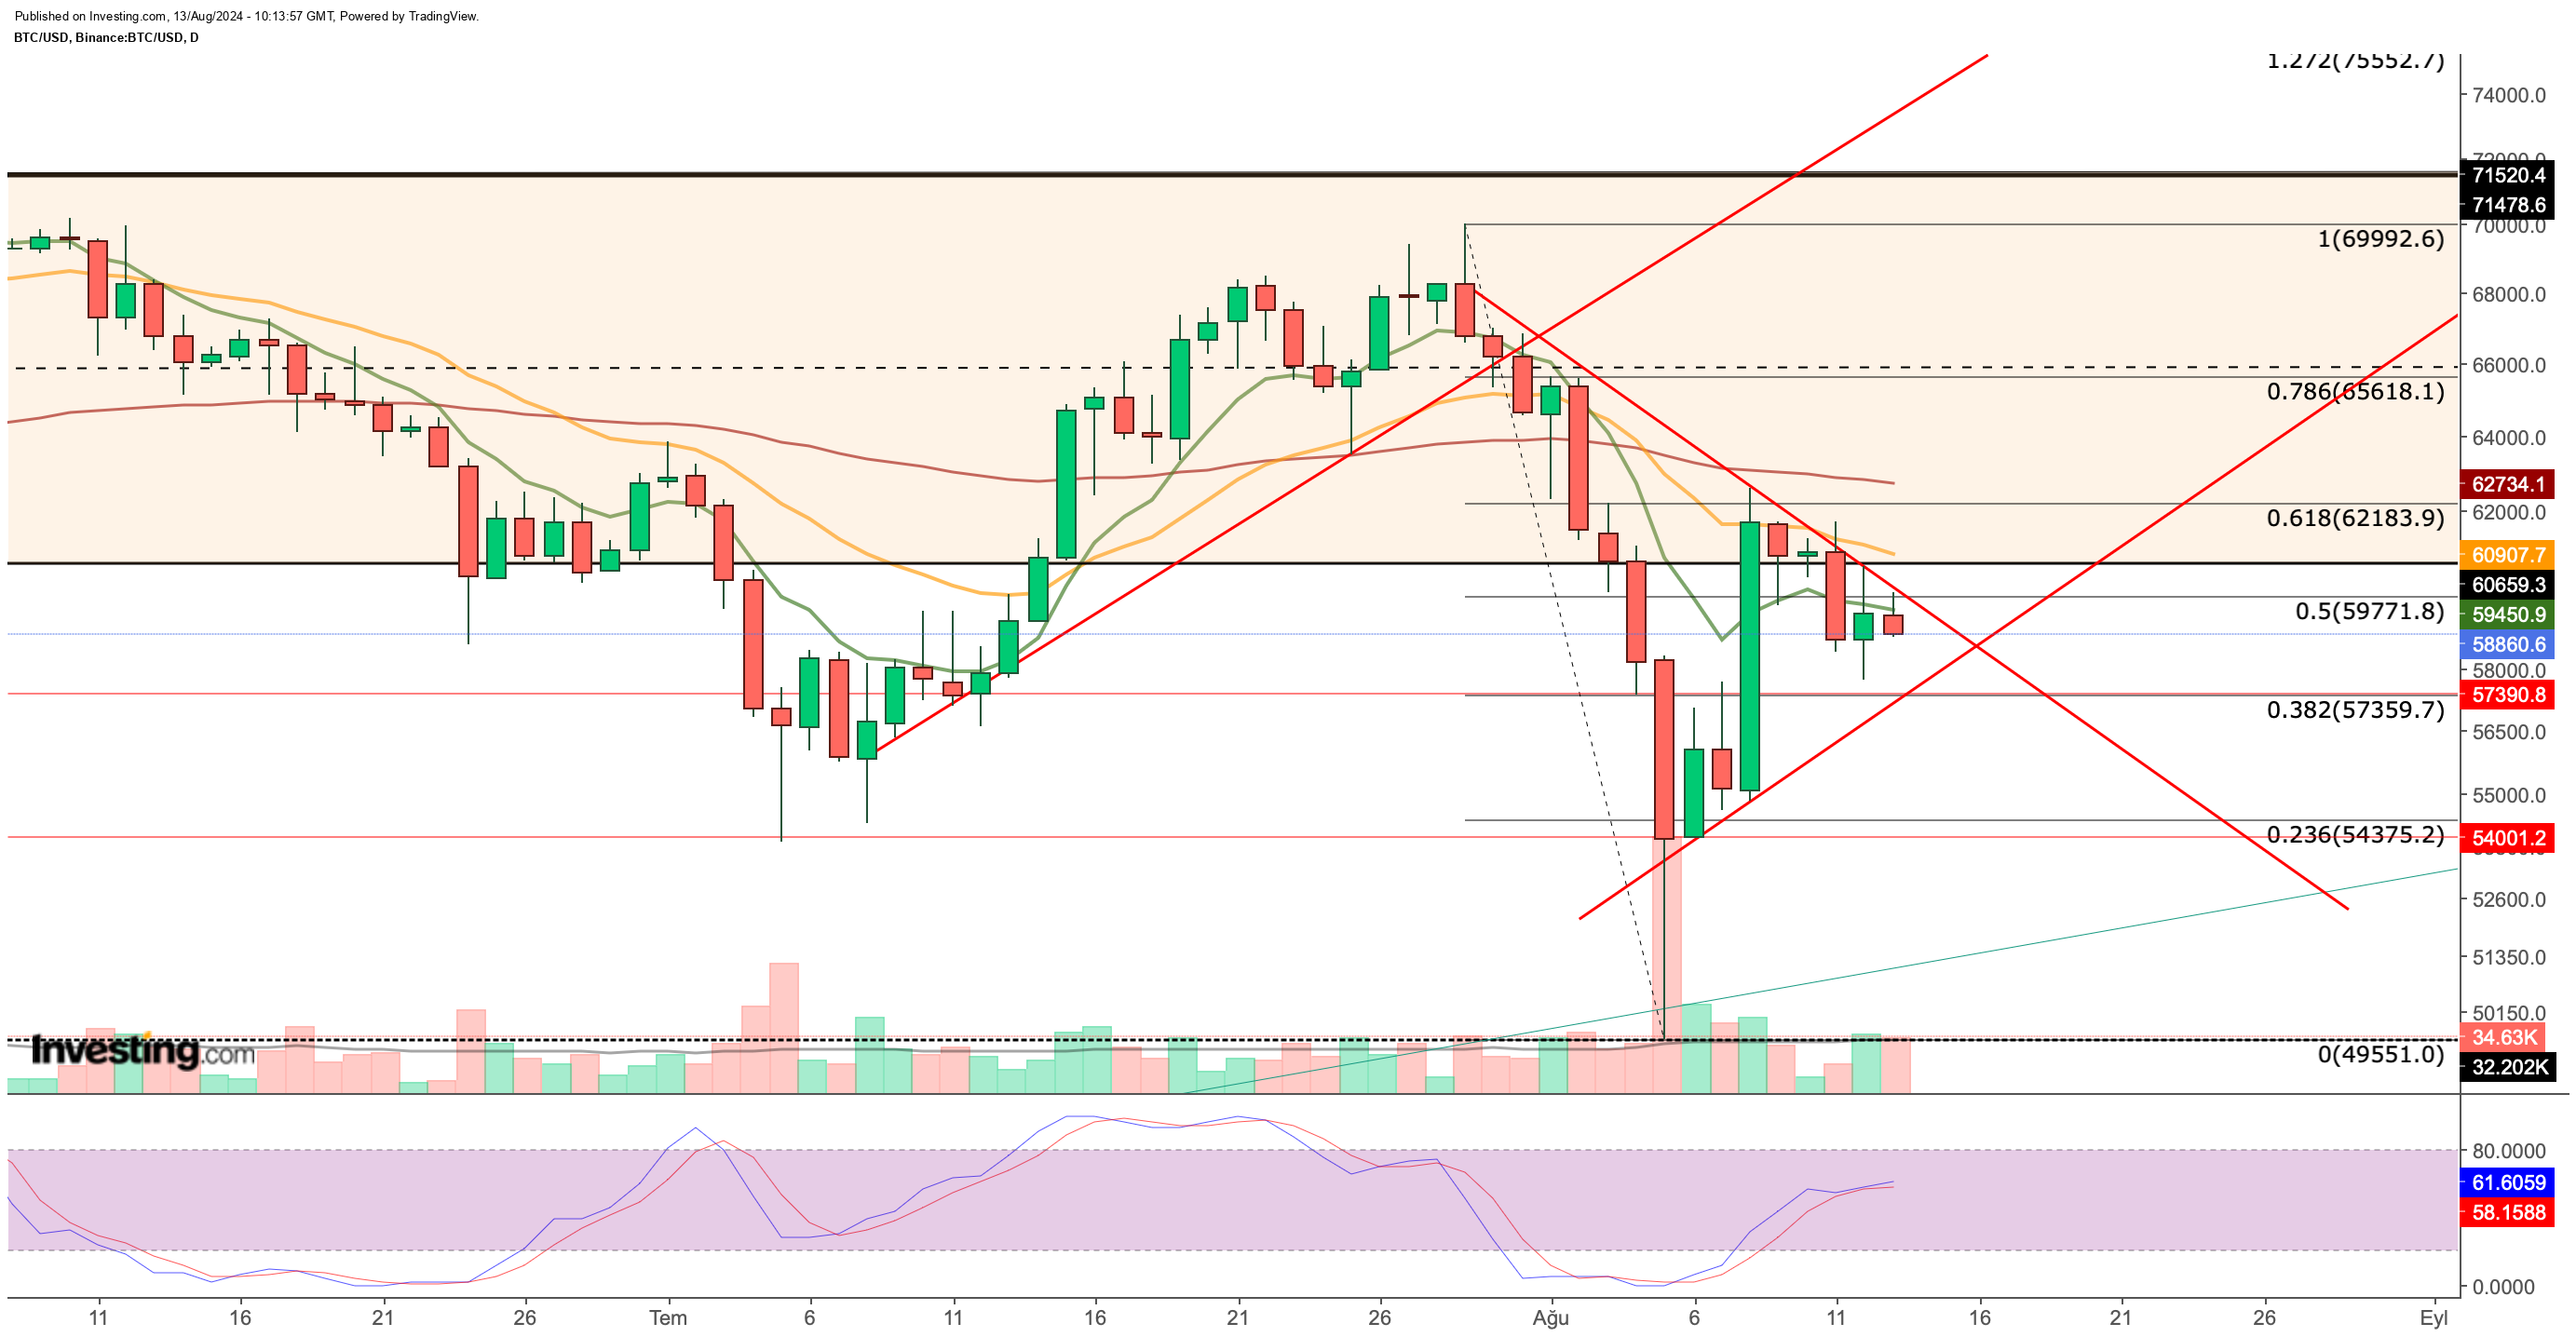
Bitcoin quickly bounced back after dipping to $49,500 last week, but the cryptocurrency has struggled to break into the $60,000 range as the new week begins.

Currently, the $61,000-$62,000 range has emerged as a critical resistance zone for further recovery. Ahead of this, the short-term EMA presents an intermediate resistance at $59,450. A weekly close above $61,000 would signal a potential break from the recent downtrend.
If macroeconomic data aligns with expectations, Bitcoin could target $62,700 and $65,600 in the short term. Clear daily closes above these levels could trigger a rally towards $70,000.
On the downside, Fibonacci levels suggest $57,350 as the nearest support point. A daily close below this level would violate the trend line formed during the recovery, potentially pushing prices below $55,000 and extending the downward trend.
In summary, Bitcoin appears poised to break out of the symmetrical triangle pattern formed by August’s accelerated decline and subsequent recovery efforts.
Ethereum: Critical Support and Resistance Levels to Watch
Ethereum surged towards the $3,500 mark ahead of the last ETF trade, but faced selling pressure and turned negative in the first month of ETF trading.
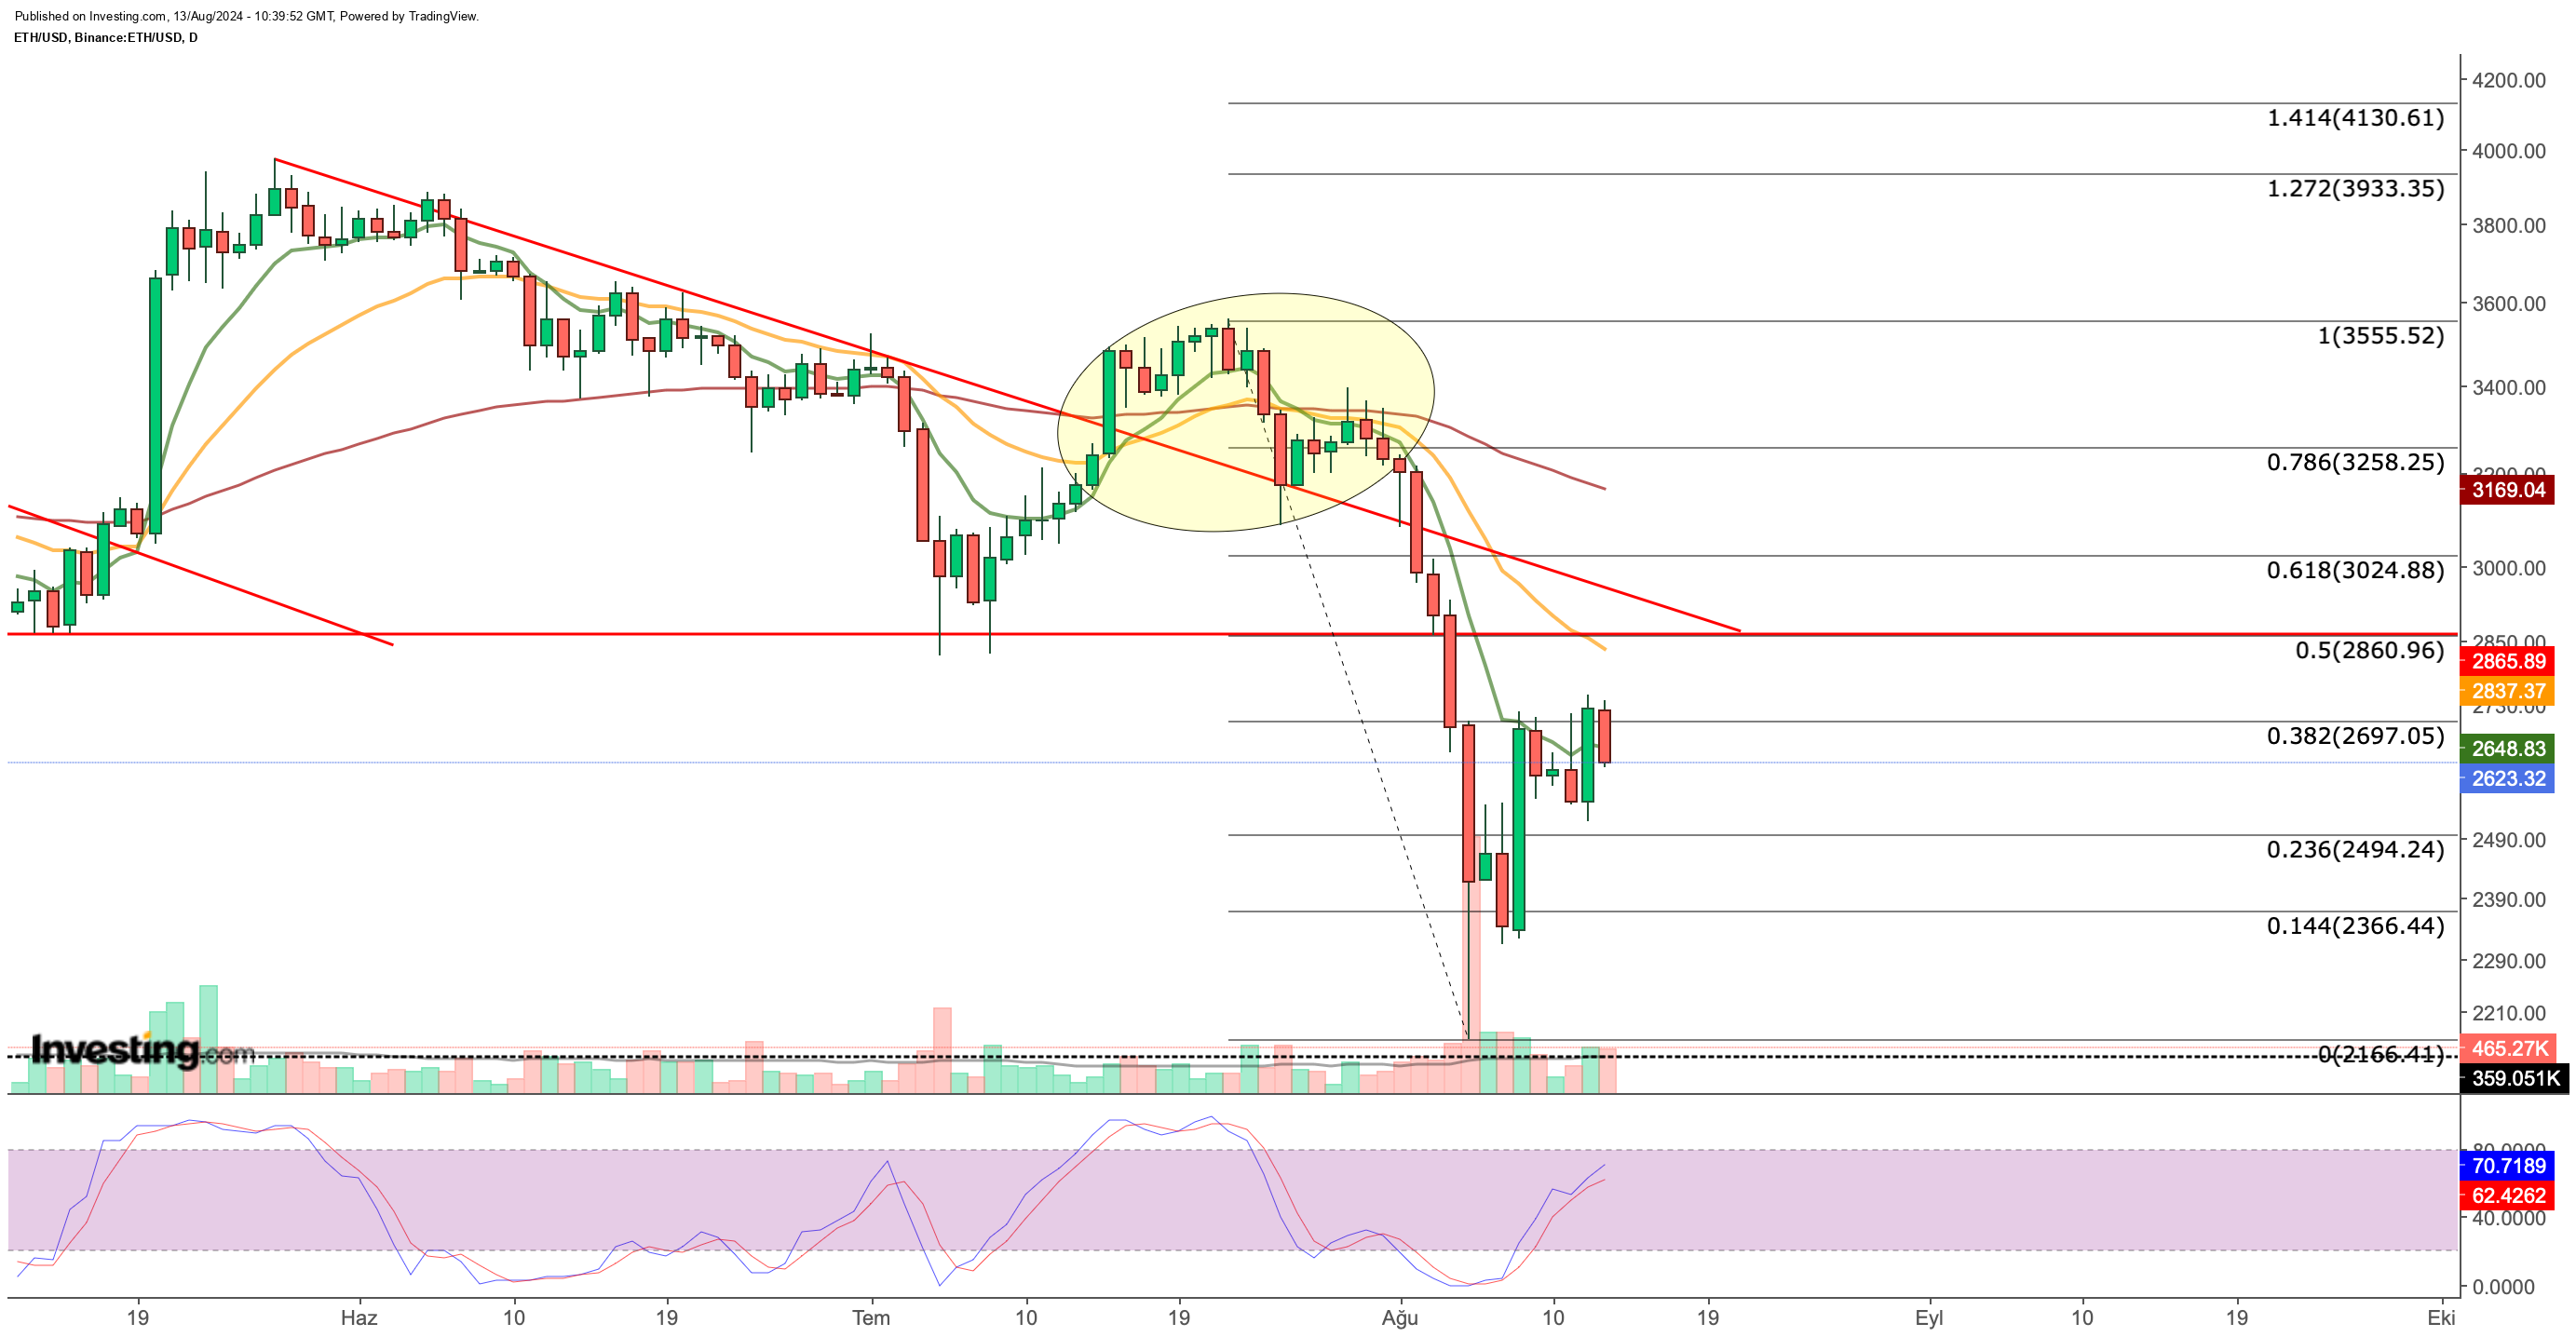
A broader market sell-off then drove ETH toward the declining trendline established in May. After breaking the key support at $2,860, Ethereum encountered resistance at $2,700 in its new trajectory.

In the second half of July, ETH struggled to retest previous levels after facing selling pressure near a breakout zone, as indicated by short-term EMA values. This failure caused the moving averages to lose their upward momentum, signaling a bearish trend. Consequently, Ethereum experienced another wave of selling, remaining below its EMA values.
Between July 22 and August 5, the bearish momentum positioned $2,700 (aligned with Fib 0.382) as the nearest resistance level. Should Ethereum surpass this resistance on daily closes, the next targets are $2,860, $3,025, and $3,260.
On the downside, $2,650 currently serves as a weak support level. A drop below this value could push Ethereum towards the $2,500 mark. However, if Ethereum manages to hold above $2,500 during a potential pullback, it could set the stage for a more stable climb toward its upside targets.
In summary, the $2,700 resistance level is crucial for Ethereum this week. A clean break above $2,800 is necessary for recovery to continue; otherwise, renewed selling pressure may drive the cryptocurrency further down.
***
This summer, get exclusive discounts on our subscriptions, including annual plans for less than $8 a month.
Try InvestingPro today and take your investing game to the next level.

Disclaimer: This article is written for informational purposes only. It is not intended to encourage the purchase of assets in any way, nor does it constitute a solicitation, offer, recommendation or suggestion to invest. I would like to remind you that all assets are evaluated from multiple perspectives and are highly risky, so any investment decision and the associated risk is at the investor's own risk. We also do not provide any investment advisory services.
