- Bitcoin recently surged, overcoming short-term hurdles, with a focus on key resistance levels at $46,675 and $47,150, paving the way for a potential move towards $50,000.
- The upcoming halving in April and other tailwinds contribute to the bullish sentiment, suggesting a potential acceleration towards $51,700.
- With Fibonacci levels and the Stochastic RSI signaling potential gains, raising the prospect of reaching $57,000 in the coming weeks.
- In 2024, invest like the big funds from the comfort of your home with our AI-powered ProPicks stock selection tool. Learn more here>>
Bitcoin prices have surged recently, breaking free from the crypto's sluggish start to February.
With that, the losses incurred post-ETF approval have been mainly recuperated, with Bitcoin now revisiting the volatile zone observed during the ETF approval week.
The downturn witnessed during that period was predominantly driven by institutional selling to capitalize on the ETF-induced demand surge.
However, this week, buyers have regained momentum, pushing the price upwards after a brief consolidation period in early February.
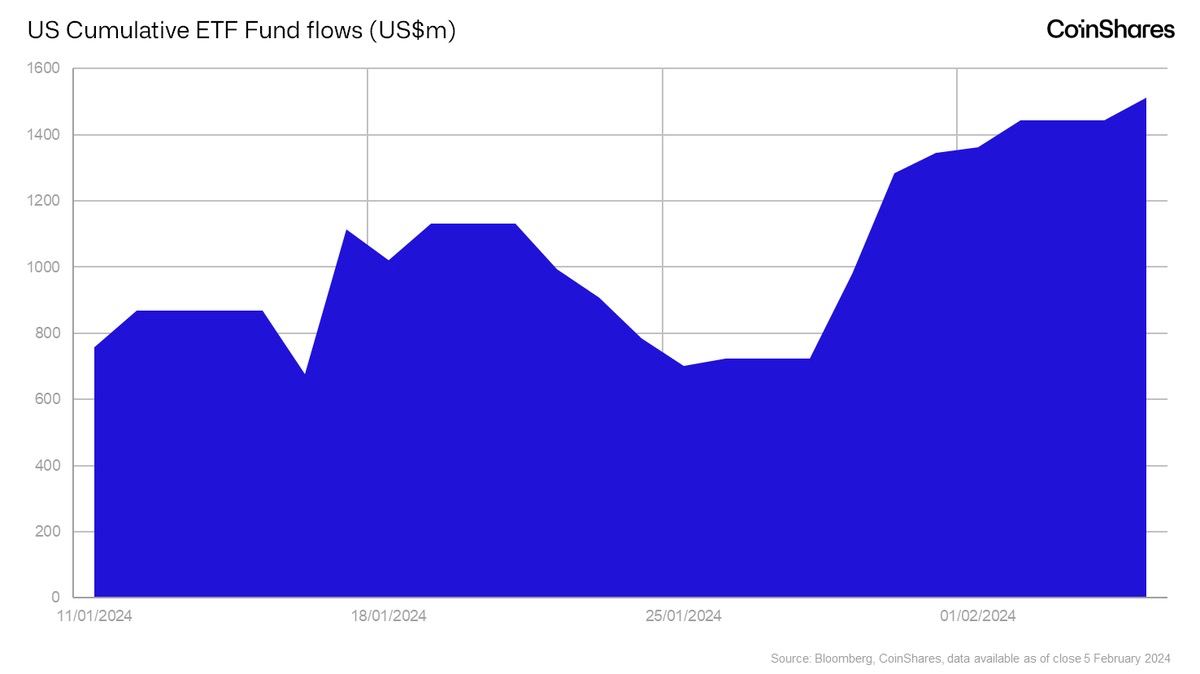
Notably, the bullish momentum in Bitcoin's price aligns with the increase in fund flows in spot ETFs.
As GBTC redemptions decreased during this period, it positively influenced ETF net fund flows and Bitcoin's price.
In today's analysis, we will examine the essential support and resistance levels that play a crucial role in determining Bitcoin's price movement in both the short and medium term.
Halving Set to Impact Price
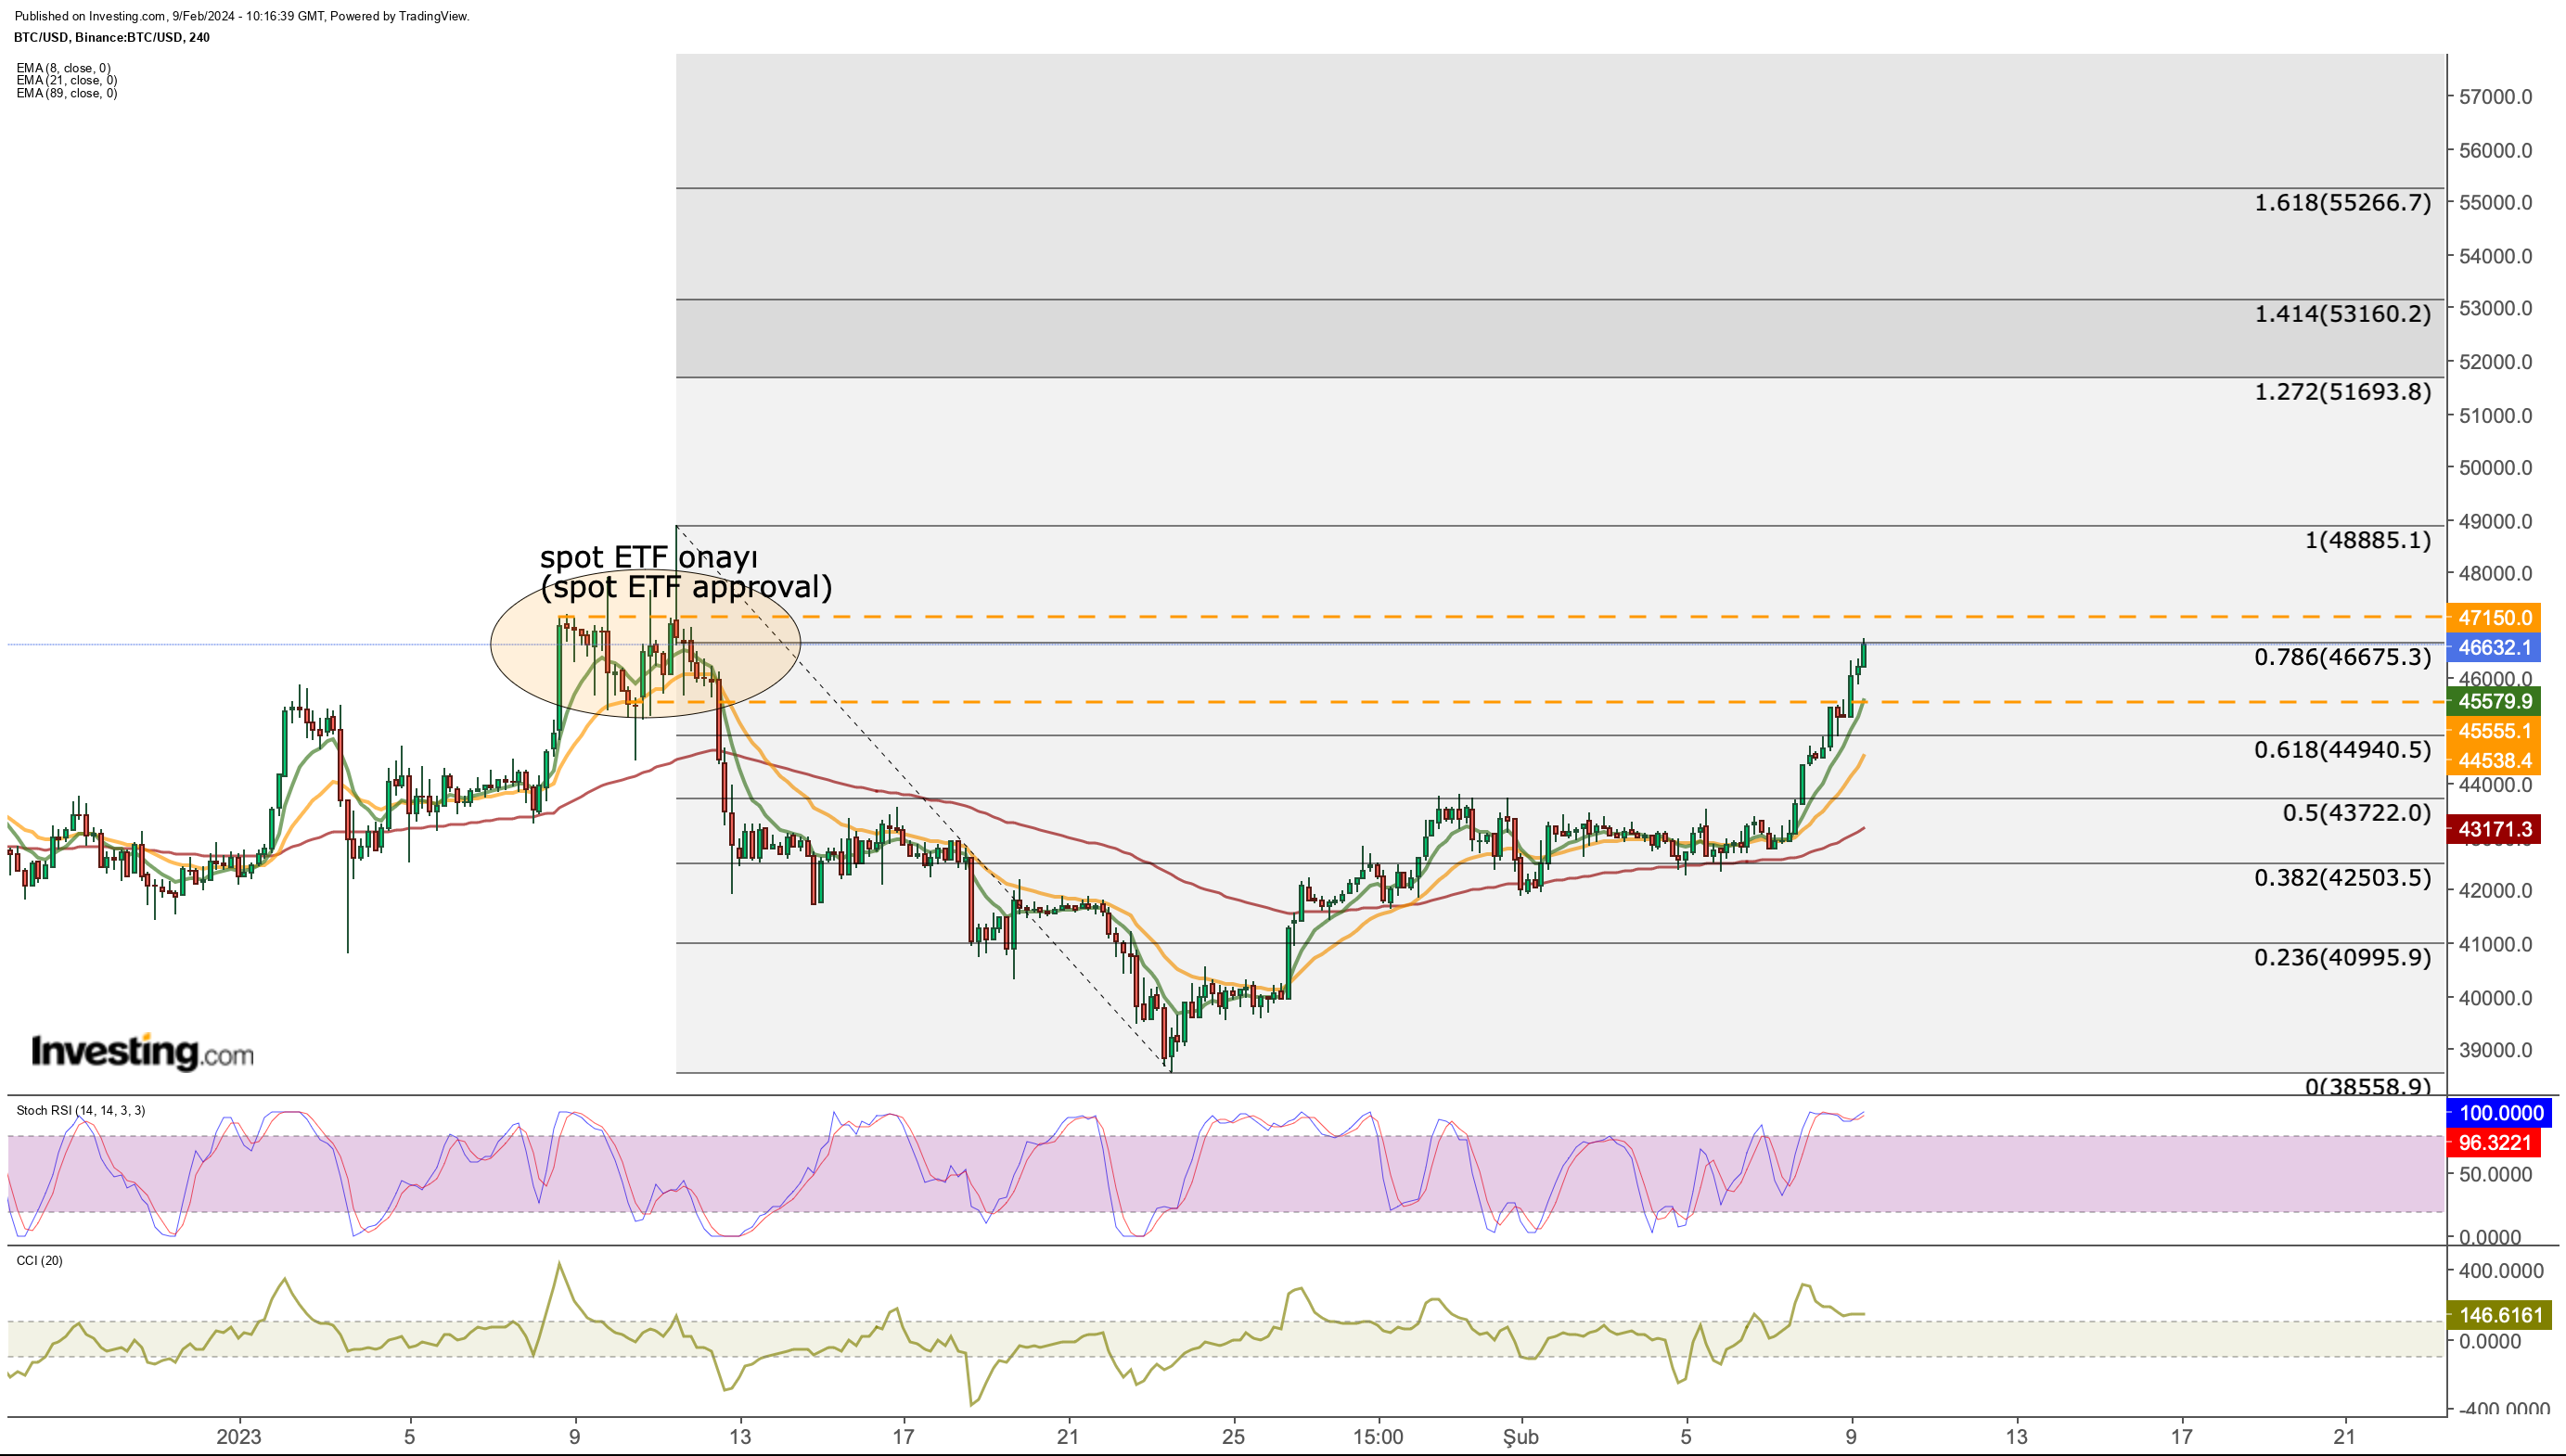
Looking at Bitcoin's short-term movements through the 4-hour chart, we observe a surge to $48,885 following the spot ETF approval on January 11th, swiftly followed by a steep decline to the $38,500 range over the next 12 days.
Additionally to the aforementioned factors, the market's focus on the upcoming halving scheduled for April has begun to impact Bitcoin demand positively.

Analyzing the past month, we observe that the $46,675 level (Fib 0.786) serves as the initial resistance point when considering the highs and lows.
This resistance line may stretch up to $47,150, considering the recent market activity. Surpassing this hurdle, the heightened risk appetite could propel Bitcoin towards the $50,000 range.
Furthermore, the $50,000 mark, viewed as a psychological level, maybe surpassed swiftly, initiating a rapid acceleration towards $51,700 based on Fibonacci expansion levels.

If we check the support zones in the short-term outlook; The first point to be considered in a possible retreat seems to be at $ 45,500.
This price level can work as an important support line again at the point where the breakthrough occurred last month.
Therefore, it may make sense to stop losses for daily closes below the $45,000 - $45,500 range in buying positions. This implies a risk premium of 3 - 3.5% from current levels.
When we look at Bitcoin from a broader perspective with the weekly chart, the continuation of the current trend with upward pressure seems to be the first noticeable situation.
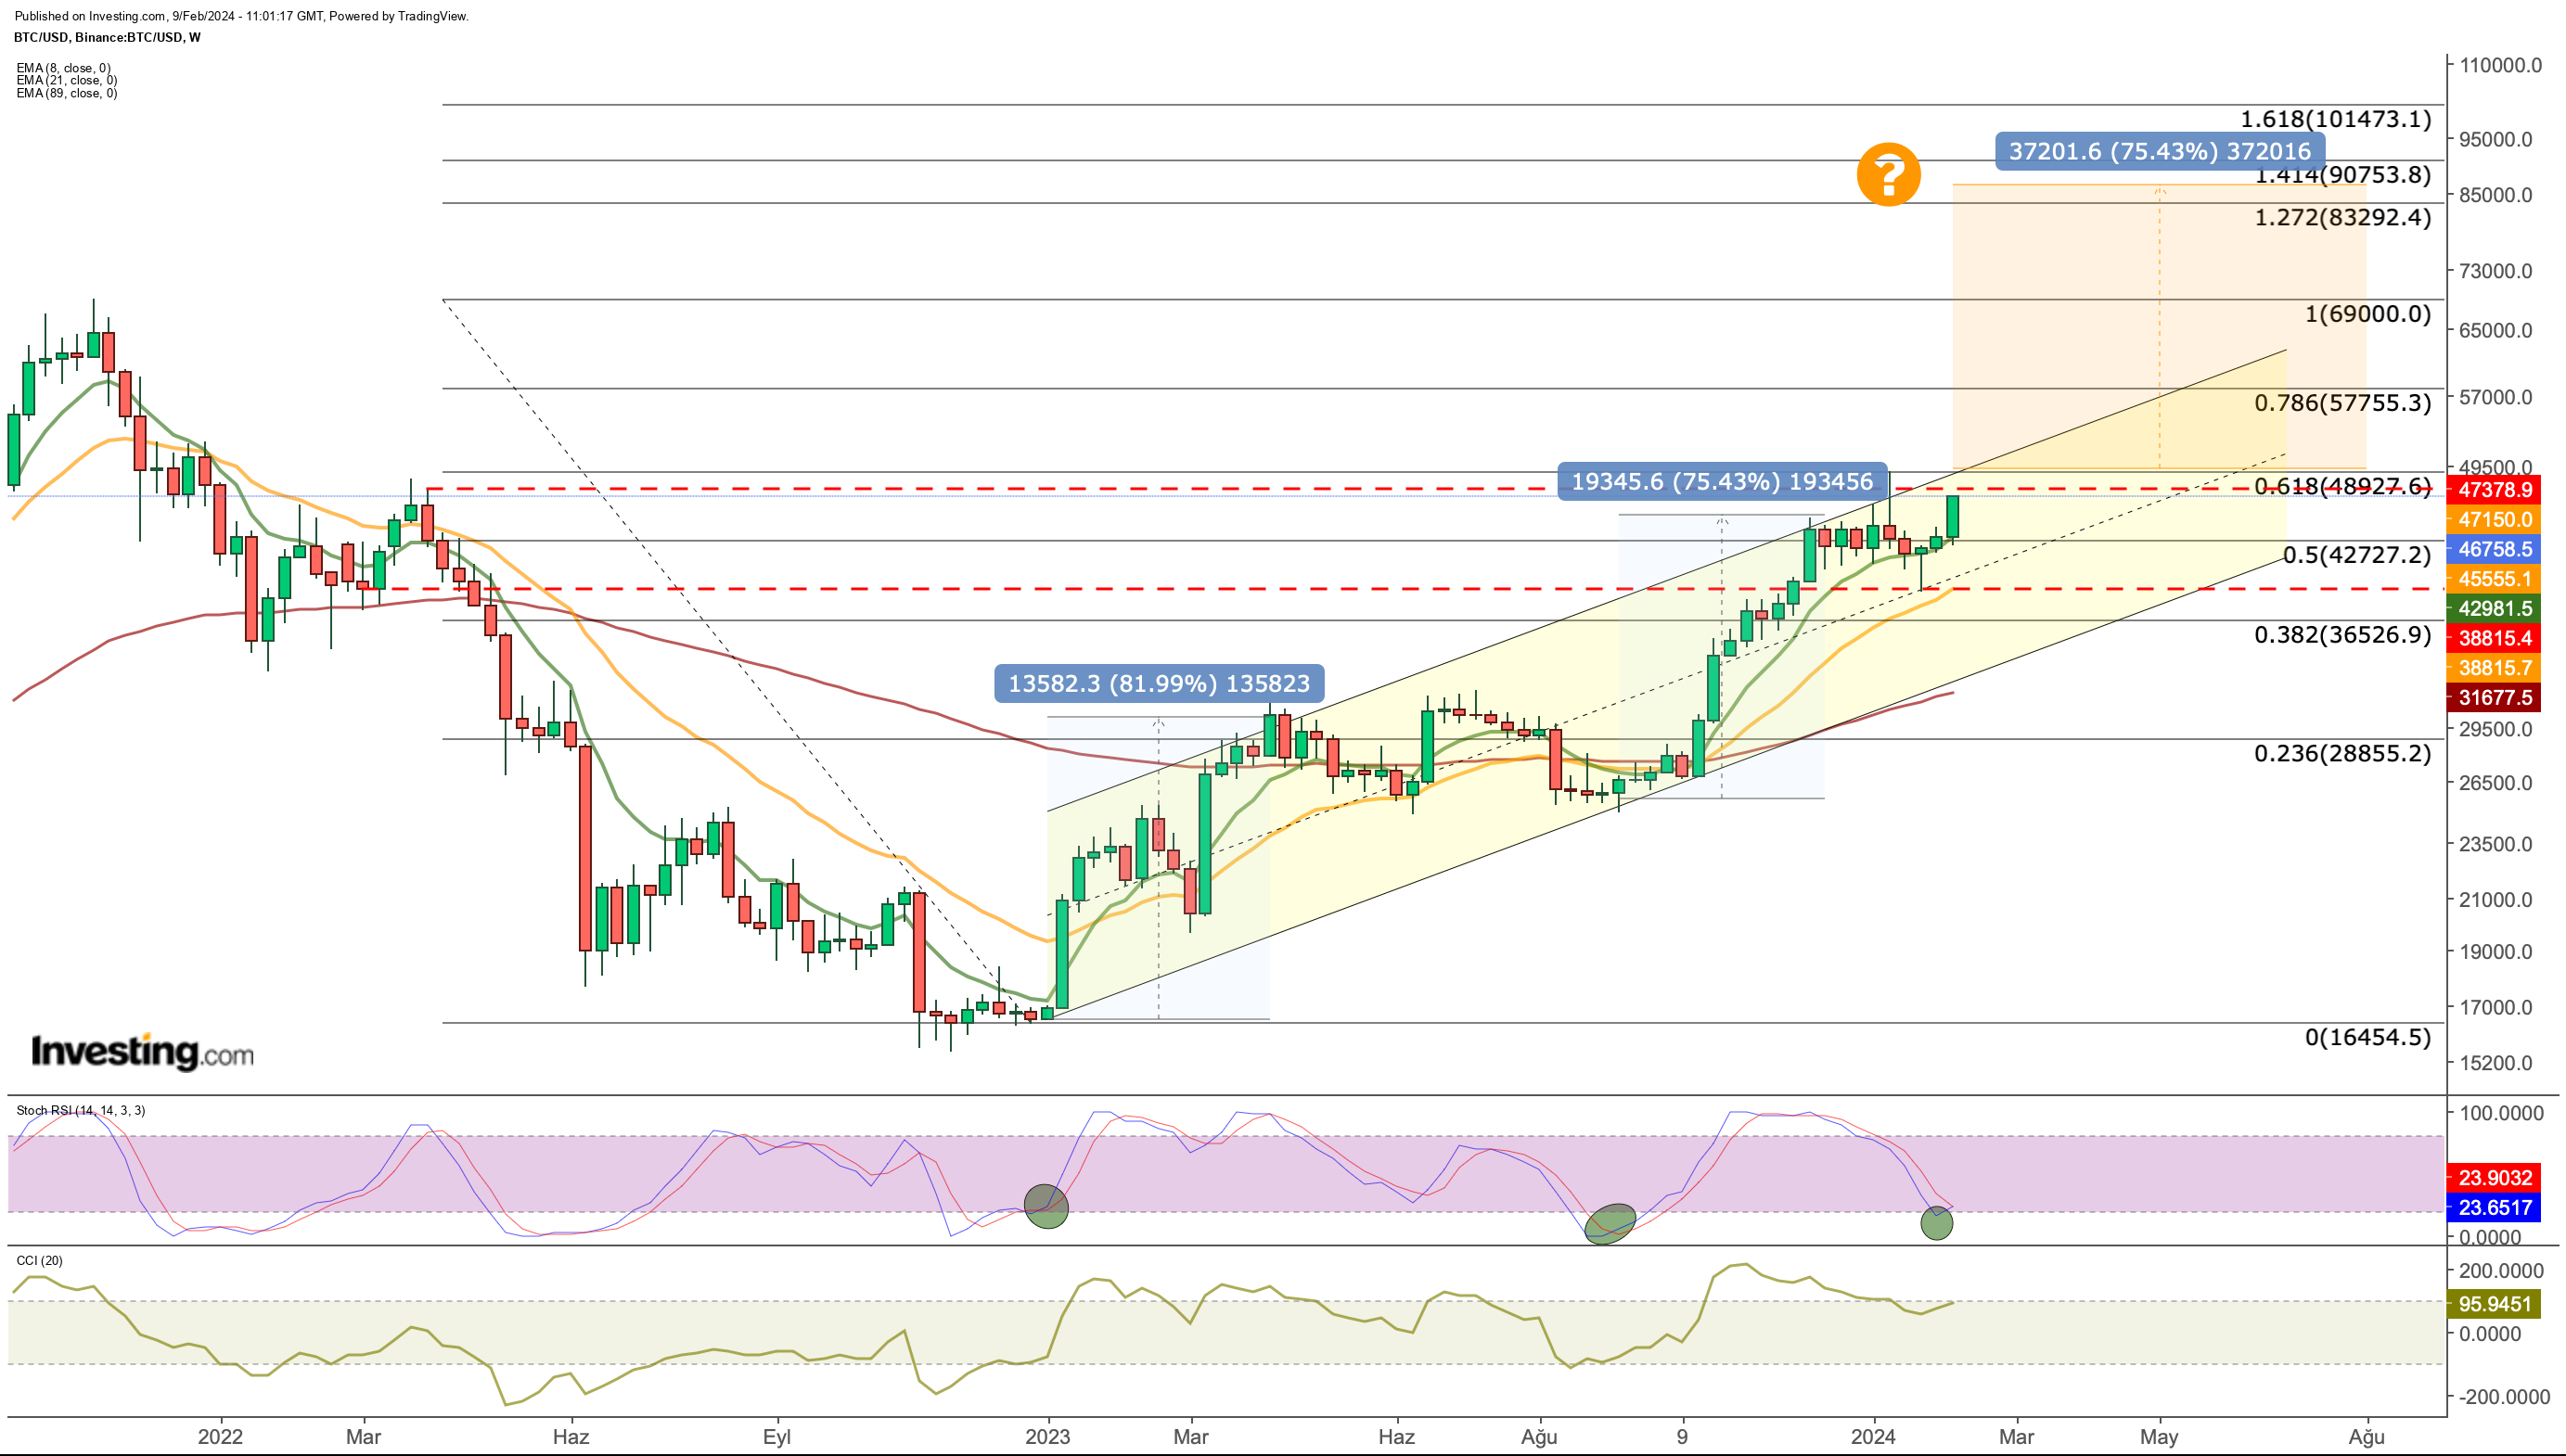
Bitcoin price, which has not broken at the upper band of the upward channel, is moving towards $ 48,900, which corresponds to Fib 0.618 according to Fibonacci levels measured based on both the upper band and the bear season.
This level was tested briefly during last month's bounce. At the same time, the current price area is extremely important as the price range where the reactionary purchases at the beginning of the bear market were made.
Another bullish sign on the weekly chart is the Stochastic RSI indicator, which is trending upwards.
This indicator hints that Bitcoin could accelerate quickly above the resistance line.
Based on last year's price action, the Stoch RSI has only moved up from the current zones twice, and in both cycles, it pointed to price gains of around 80%.
A repeat of this cycle by breaking through the current resistances would imply a rise towards the $80,000 area within 6 months on average.
On the other hand, the correction that followed the first positive cycle in 2023 was longer lasting.
In the second cycle, the Stochastic RSI approached the oversold zone in a shorter period and this time the correction was much more limited as demand remained brisk in the lower area.
This can be considered as an additional signal that the uptrend may continue strongly.
If we summarize the short-term targets; While the range of $ 46,675 - 47,150 is important in the 4-hour view, the weekly chart emphasizes the importance of the $ 48,900 level above this area.
Above this resistance line, $ 51,700 can be considered as the first price target. If the trend continues, it may be possible to see a rise towards the $ 57,000 area in the coming weeks.
***
Take your investing game to the next level in 2024 with ProPicks
Institutions and billionaire investors worldwide are already well ahead of the game when it comes to AI-powered investing, extensively using, customizing, and developing it to bulk up their returns and minimize losses.
Now, InvestingPro users can do just the same from the comfort of their own homes with our new flagship AI-powered stock-picking tool: ProPicks.
With our six strategies, including the flagship "Tech Titans," which outperformed the market by a lofty 1,183% over the last decade, investors have the best selection of stocks in the market at the tip of their fingers every month.
Subscribe here and never miss a bull market again!
Don't forget your free gift! Use coupon code OAPRO1 at checkout for a 10% discount on the Pro yearly plan, and OAPRO2 for an extra 10% discount on the by-yearly plan.
Disclaimer: This article is written for informational purposes only; it does not constitute a solicitation, offer, advice, or recommendation to invest as such it is not intended to incentivize the purchase of assets in any way. I would like to remind you that any type of asset, is evaluated from multiple points of view and is highly risky and therefore, any investment decision and the associated risk remains with the investor.

