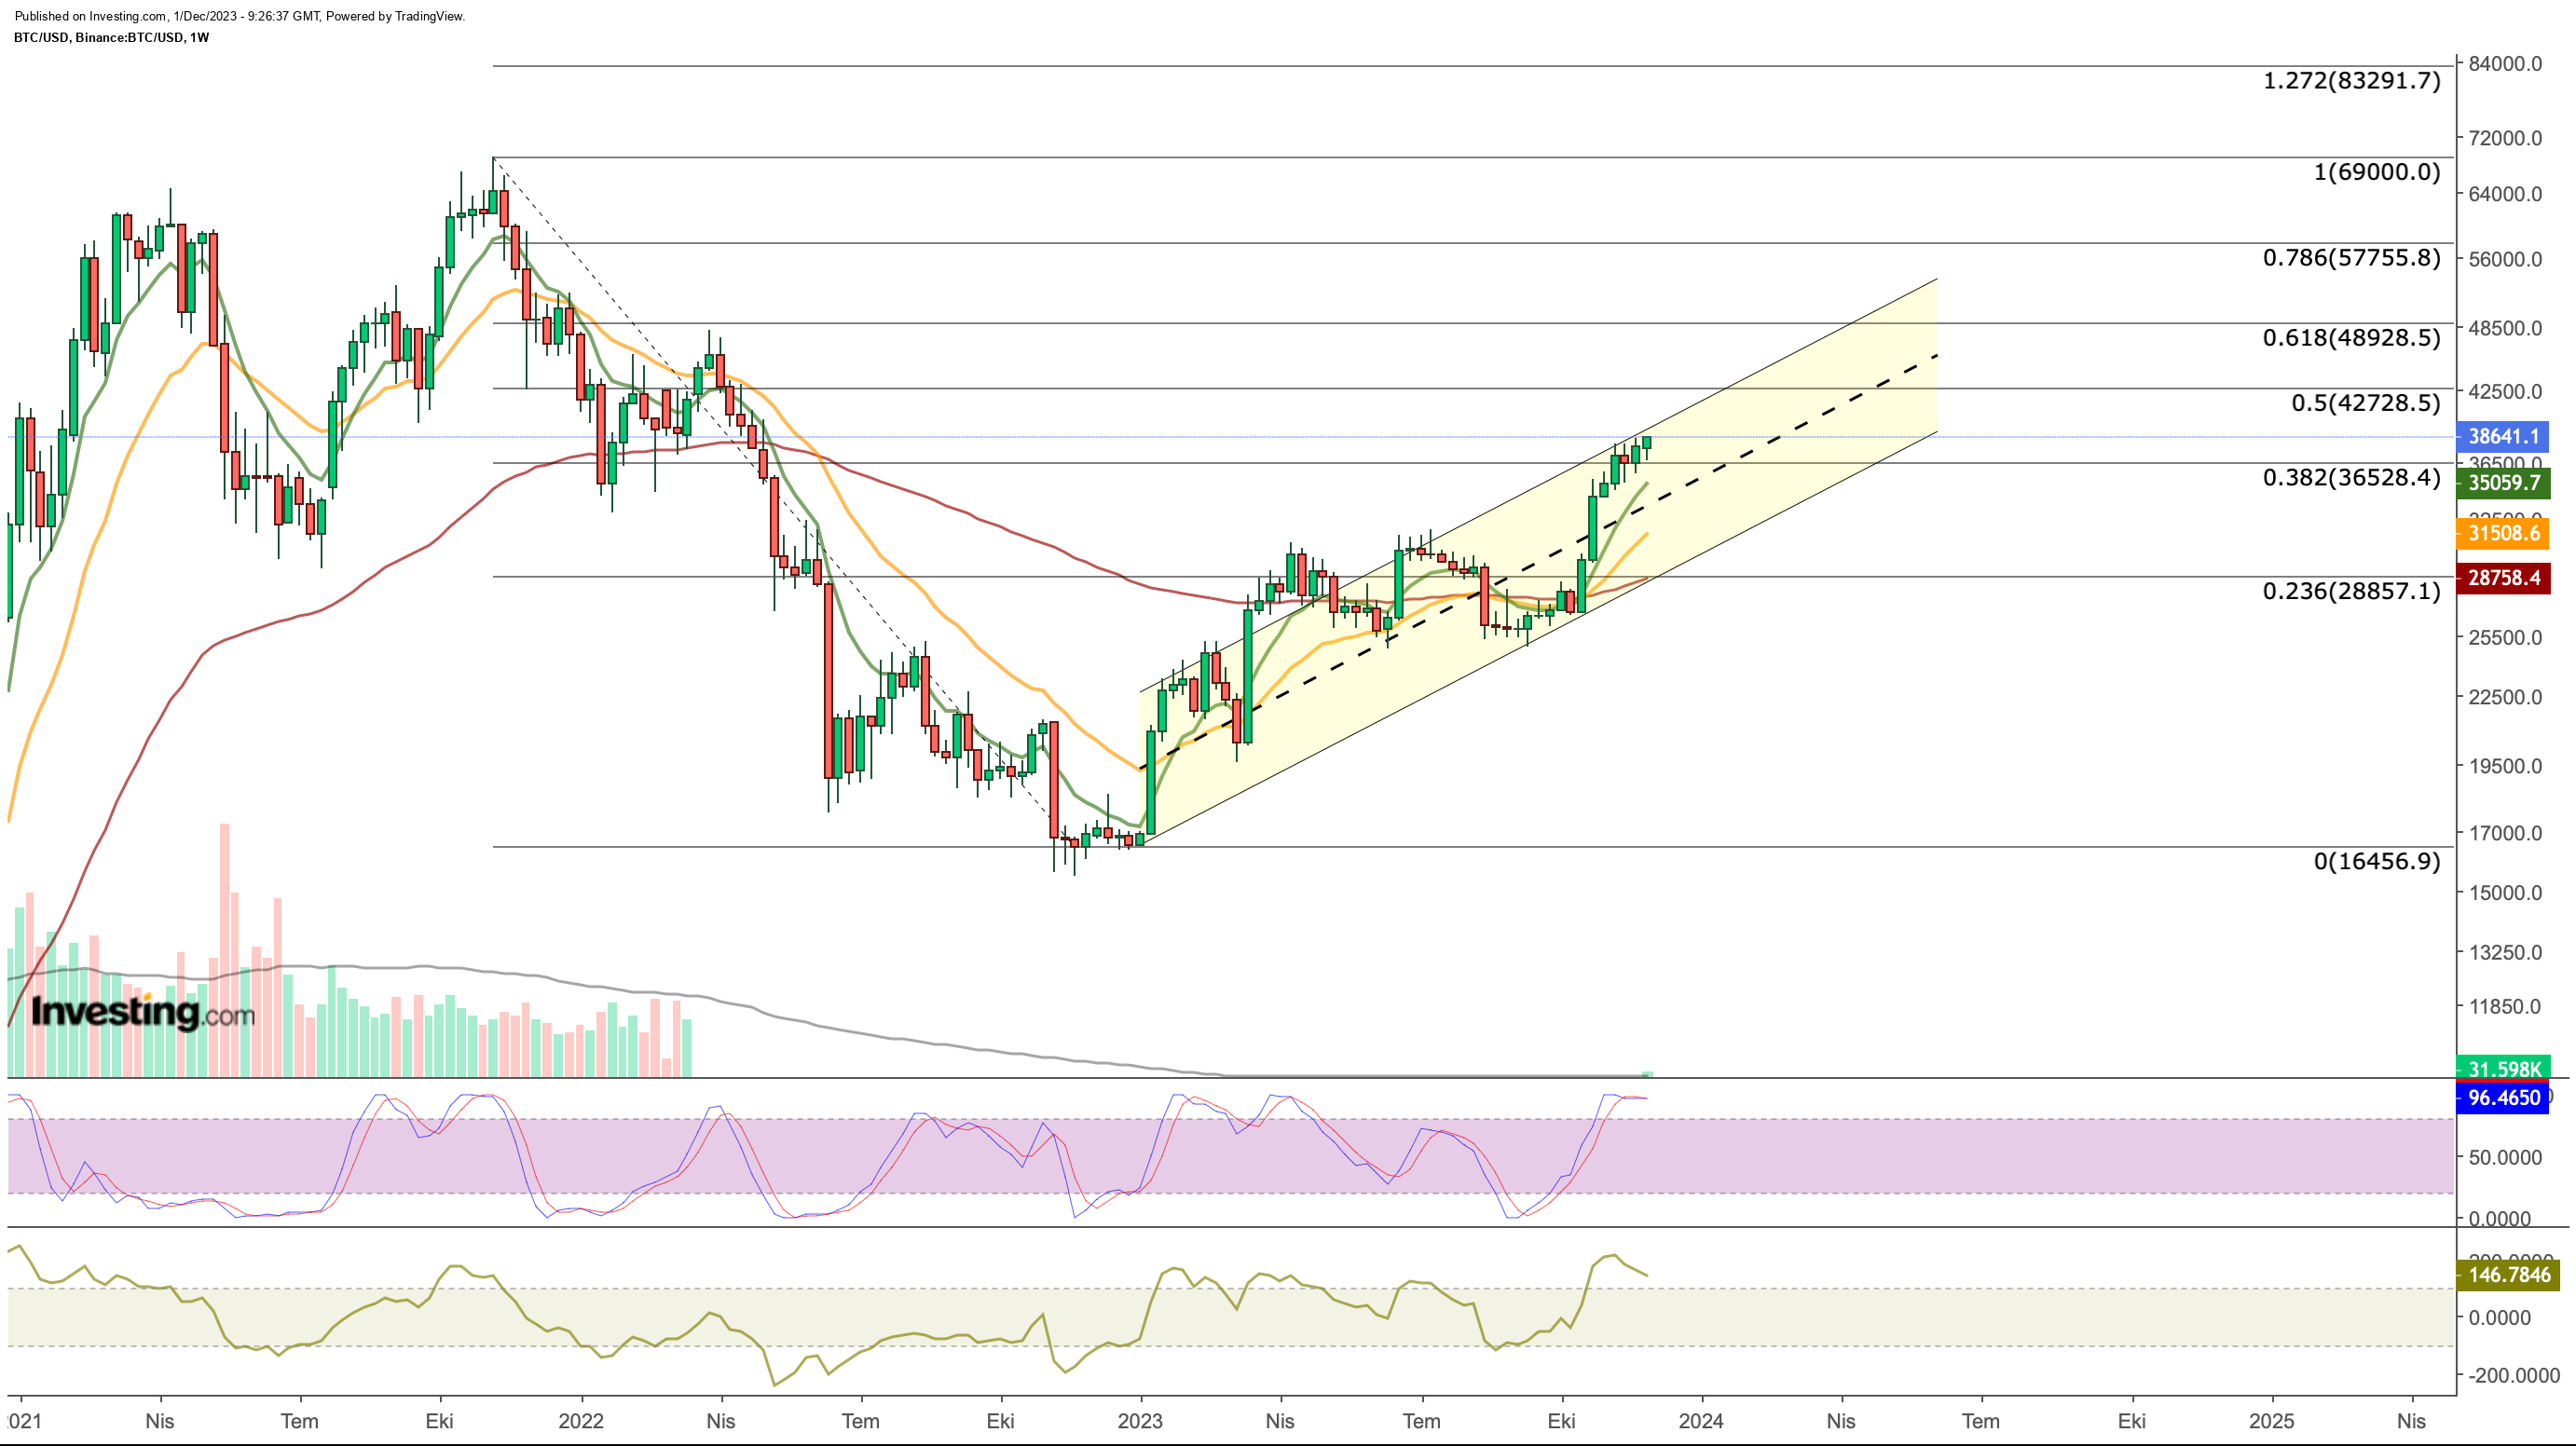
- Bitcoin concludes November on a high, continuing its two-month upward trend, reaching the upper band of the rising channel, and encountering resistance around $38,000.
- The critical support level at $36,500 is pivotal for Bitcoin's momentum towards the $42,000 to $48,000 resistance zone, aligned with Fib 0.382 from the bear market's downward trend.
- Caution is warranted as the Stochastic RSI remains in the overbought zone, and failure to maintain $36,500 support might trigger a retracement, potentially influenced by negative news or a hawkish shift by the Fed.
- Missed out on Black Friday? Secure your up to 55% discount on InvestingPro subscriptions with our extended Cyber Monday sale.
Closing November with an 8.86% increase in value, Bitcoin has sustained its upward trend for the past two months.
Throughout 2023, the cryptocurrency has been moving within a rising channel. In the second half of November, it reached the upper band of this channel. While facing some resistance around the $38,000 mark, Bitcoin found support at the $36,500 level in the lower region. A closer look at the support zone reveals that it aligns with Fib 0.382, derived from the bear market's downward trend.
As long as Bitcoin maintains support around $36,500, it is likely to continue its movement towards the next resistance zone, targeting $42,000 to $48,000. The cryptocurrency encountered some difficulty crossing the upper channel border but has continued to move along this border, sustained by demand from the lower region.
On the weekly chart, the steep acceleration of the exponential moving average values in the last month remains valid as a technical argument supporting the upward movement. However, in the long-term outlook, the fact that the Stochastic RSI remains horizontal at the top of the overbought zone can be considered a warning sign.
At this point, the $36,500 support for Bitcoin becomes important once again. If buyers manage to hold the cryptocurrency price at this level on possible pullbacks, we may see the energy of the Stochastic RSI drop and exit overbought conditions. Otherwise, if the support level is lost, the decline is likely to continue until the indicator moves down to the sell zone.

In the event of a possible correction, a retracement to the $ 34,000 levels, which coincides with the middle line of the channel, may be seen. Subsequently, there is a possibility that the downward momentum may continue towards the $ 30,000 limit depending on the in-channel movement.
However, we can see that such a retracement may occur amid negative news for Bitcoin. This negative development may be in the form of the rejection of spot Bitcoin ETF (TSX:EBIT) applications, which are currently highly anticipated. However, it can be mentioned that the evaluation postponed to January will not pose a risk this month.
Apart from this development, among the developments that will excuse a possible decline in the market may be the possibility that the Fed may return to a hawkish view. The market expectation is that the bank has entered the neutral interest rate period. If the Fed decides to raise interest rates before the end of the year, crypto markets may price this development sharply. However, this decision has a low expectation for the time being.
As a result, Bitcoin is likely to determine its trend this month, depending on whether it holds the $36,500 support, depending on possible risks.
For an upward bounce, the $38,000 line needs to be broken on volume. However, the decline in the bullish trend due to the decline in trading volume in November reflects that the current positive developments may have been priced in.
Therefore, a new bounce would require another positive news event to trigger the crypto market. Only then will we see buyer volume increase and Bitcoin break through the resistance line at $38,000 and step into the $40,000 trading area.
***
You can easily determine whether a stock is suitable for your risk profile by conducting a detailed fundamental analysis on InvestingPro according to your own criteria. This way, you will get highly professional help in shaping your portfolio.
In addition, you can sign up for InvestingPro, one of the most comprehensive platforms in the market for portfolio management and fundamental analysis, much cheaper with the biggest discount of the year (up to 55%), by taking advantage of our extended Cyber Monday deal.
Disclosure: The author does not own any of the securities mentioned in this report.

