-
Bitcoin traders eye critical resistance amid rising bond yields, greenback.
-
Key levels near $69,500 could determine Bitcoin’s breakout potential.
-
Employment data and Fed signals add pressure, with traders watching for support around $66,000.
- Looking for actionable trade ideas to navigate the current market volatility? Unlock access to InvestingPro’s AI-selected stock winners for under $9 a month!
Bitcoin’s rally from September’s lows hit a high note last week, briefly taking the cryptocurrency near $69,500.
This surge signaled a strong escape from bearish consolidation, but this week has seen softer price movement, as fresh liquidity and rising bond yields create headwinds.
Bitcoin traders now have their eyes on critical resistance levels and key drivers like the upcoming US election and employment data, which could shape the market’s next move.
Last week’s upswing brought the crypto back to a critical resistance zone, flirting with a breakout past $69,500. Political developments, including the possibility of a Trump re-election, have started influencing sentiment.
Trump’s pro-crypto stance could provide a bullish spark; however, his policies to strengthen the dollar may dampen Bitcoin’s appeal.
Conversely, a victory for Harris, who leans toward crypto regulation, might foster a stable regulatory environment. Either way, the election outcome promises to affect the medium-term outlook for Bitcoin.
Market Watch: Bonds, Dollar Strength, and Employment Data
The current week has also seen Bitcoin grapple with rising bond yields and a stronger dollar, intensifying pressure at key resistance levels.
US jobs data, particularly non-farm payrolls, could further sway Fed policy and influence Bitcoin’s path. Strong employment data may delay interest rate cuts, making the dollar yield attractive and curbing liquidity in risk assets like Bitcoin.
Meanwhile, weaker employment figures could prompt the Fed to cut rates sooner, potentially lifting Bitcoin in the short term but sparking broader recession fears that could slow crypto investment.
Geopolitical Risks and Market Liquidity
Geopolitical risks remain a wildcard. Tensions in the Middle East have eased, but any escalation that impacts global markets could weigh on Bitcoin prices.
Additionally, open positions in the crypto futures market hit new highs last week, amplifying volatility. This dynamic, coupled with fresh liquidity withdrawals, contributed to Bitcoin’s slight retreat this week.
Bitcoin’s Technical Picture: Key Levels to Watch
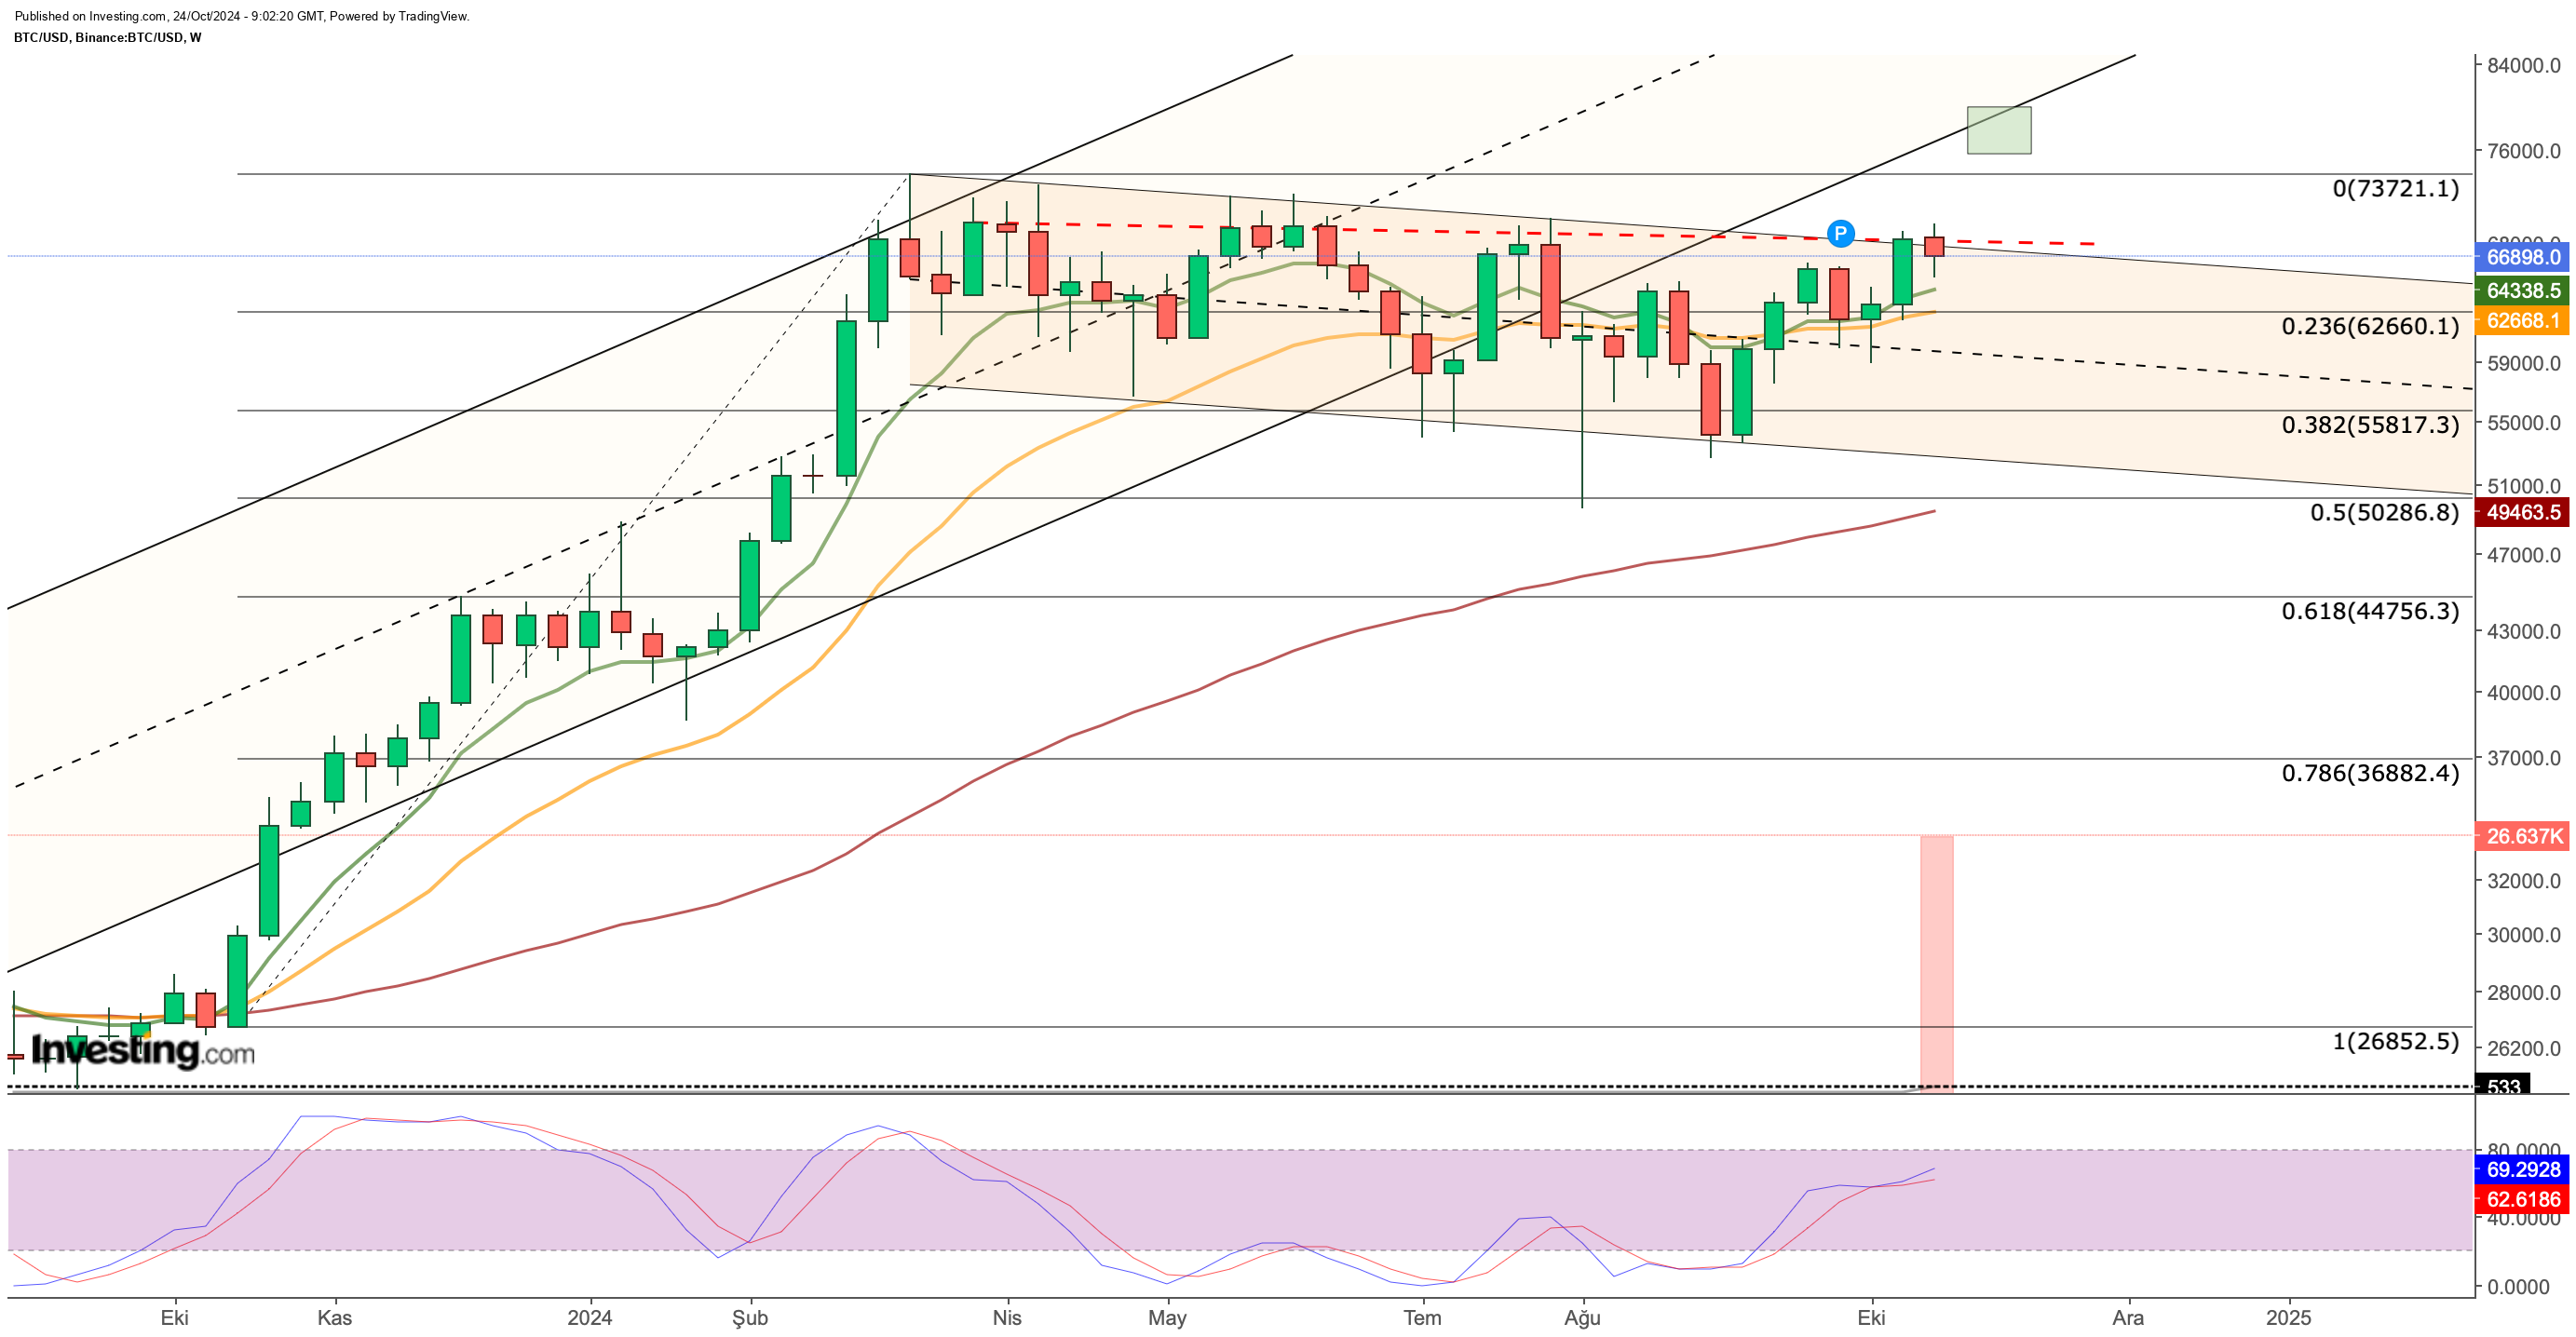
Bitcoin continues to test the upper boundary of its bearish channel, currently encountering strong resistance around $67,000. A decisive close above this level could pave the way toward $70,000 ahead of the election.

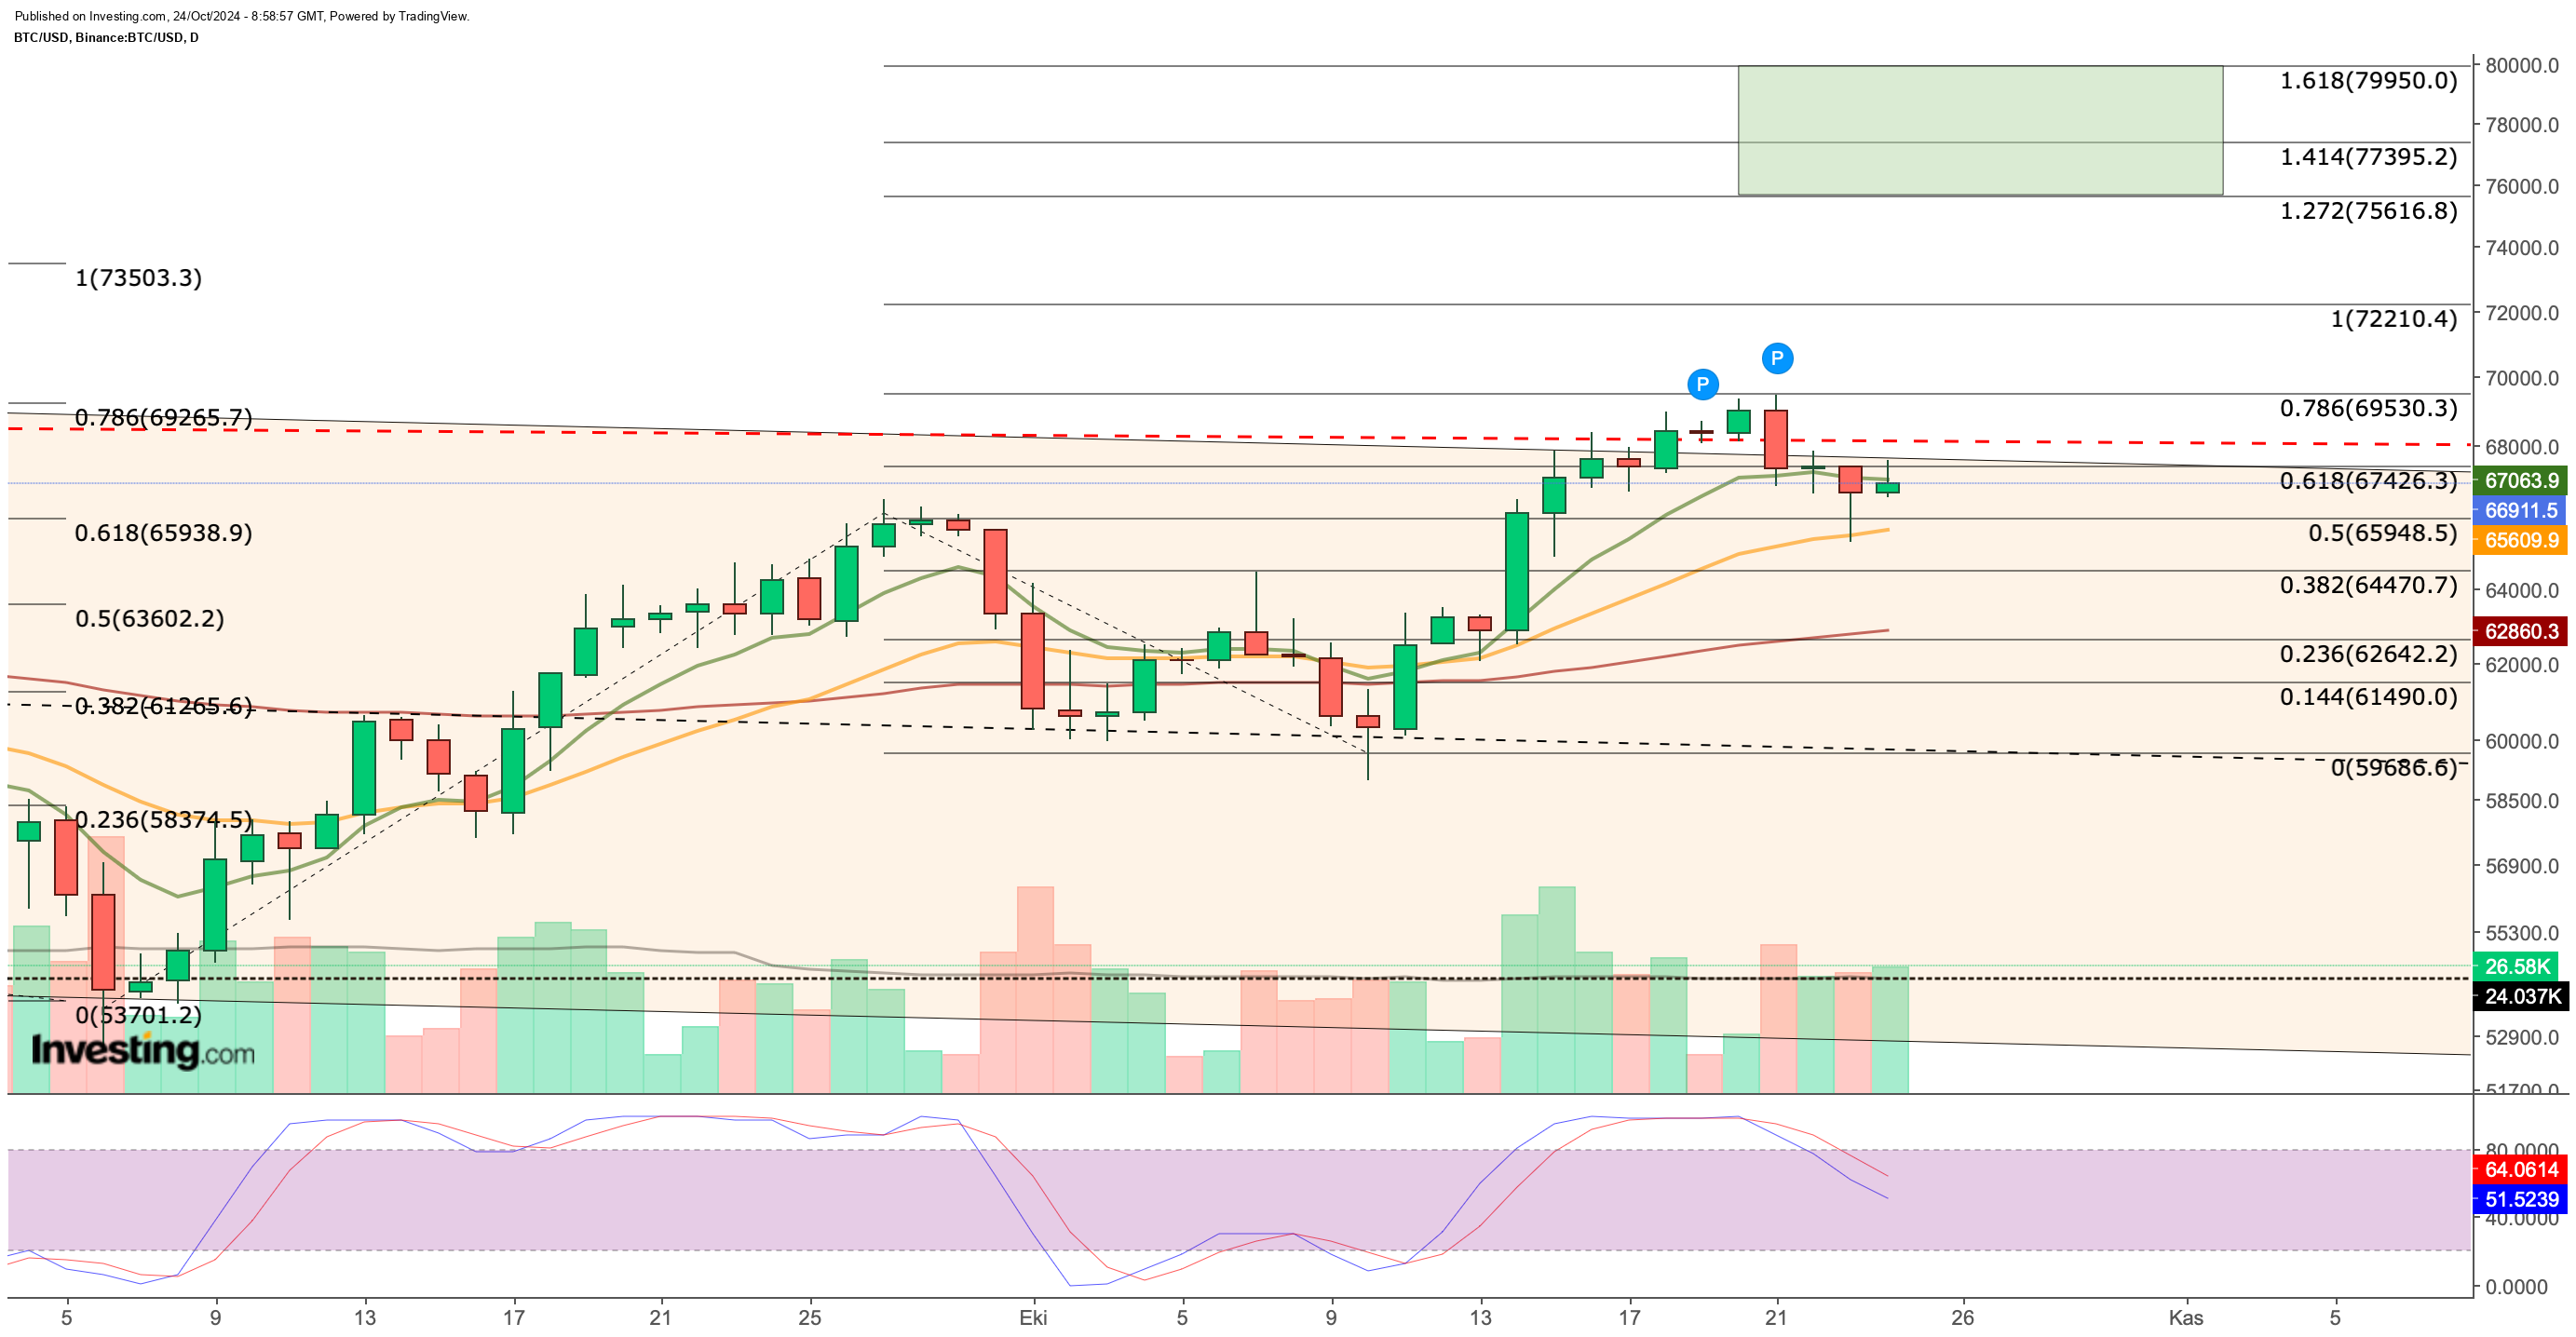
The daily chart suggests a critical support range at $65,600–65,950, with a breakdown risking a pullback to $64,400 or even $62,600.

However, if Bitcoin maintains momentum above $66,000, bullish sentiment could drive it toward $72,200 or higher, potentially pushing into the $75,000–79,000 range on sustained buying.
Disclaimer: This article is written for informational purposes only. It is not intended to encourage the purchase of assets in any way, nor does it constitute a solicitation, offer, recommendation or suggestion to invest. I would like to remind you that all assets are evaluated from multiple perspectives and are highly risky, so any investment decision and the associated risk belongs to the investor. We also do not provide any investment advisory services.
