- Cryptocurrency markets are exhibiting a stable trend this week after the initial volatility at the start of 2024.
- Following the approval of the spot Bitcoin ETF (TSX:EBIT) last week, there was a general pullback in crypto markets, but the downward momentum appears to be limited for now.
- Bitcoin retreated after reaching $49,000 post-ETF confirmation but found support around $41,700, a new bullish wave is likely if it closes above $43,500.
- Looking to beat the market in 2024? Let our AI-powered ProPicks do the leg work for you, and never miss another bull market again. Learn More »
Cryptocurrency markets are calmer this week after starting 2024 with volatile trading.
While there was a general pullback in crypto markets following the spot Bitcoin ETF approval last week, there is a view that the downward momentum remains limited for now.
Bitcoin Bulls Maintain Support Levels
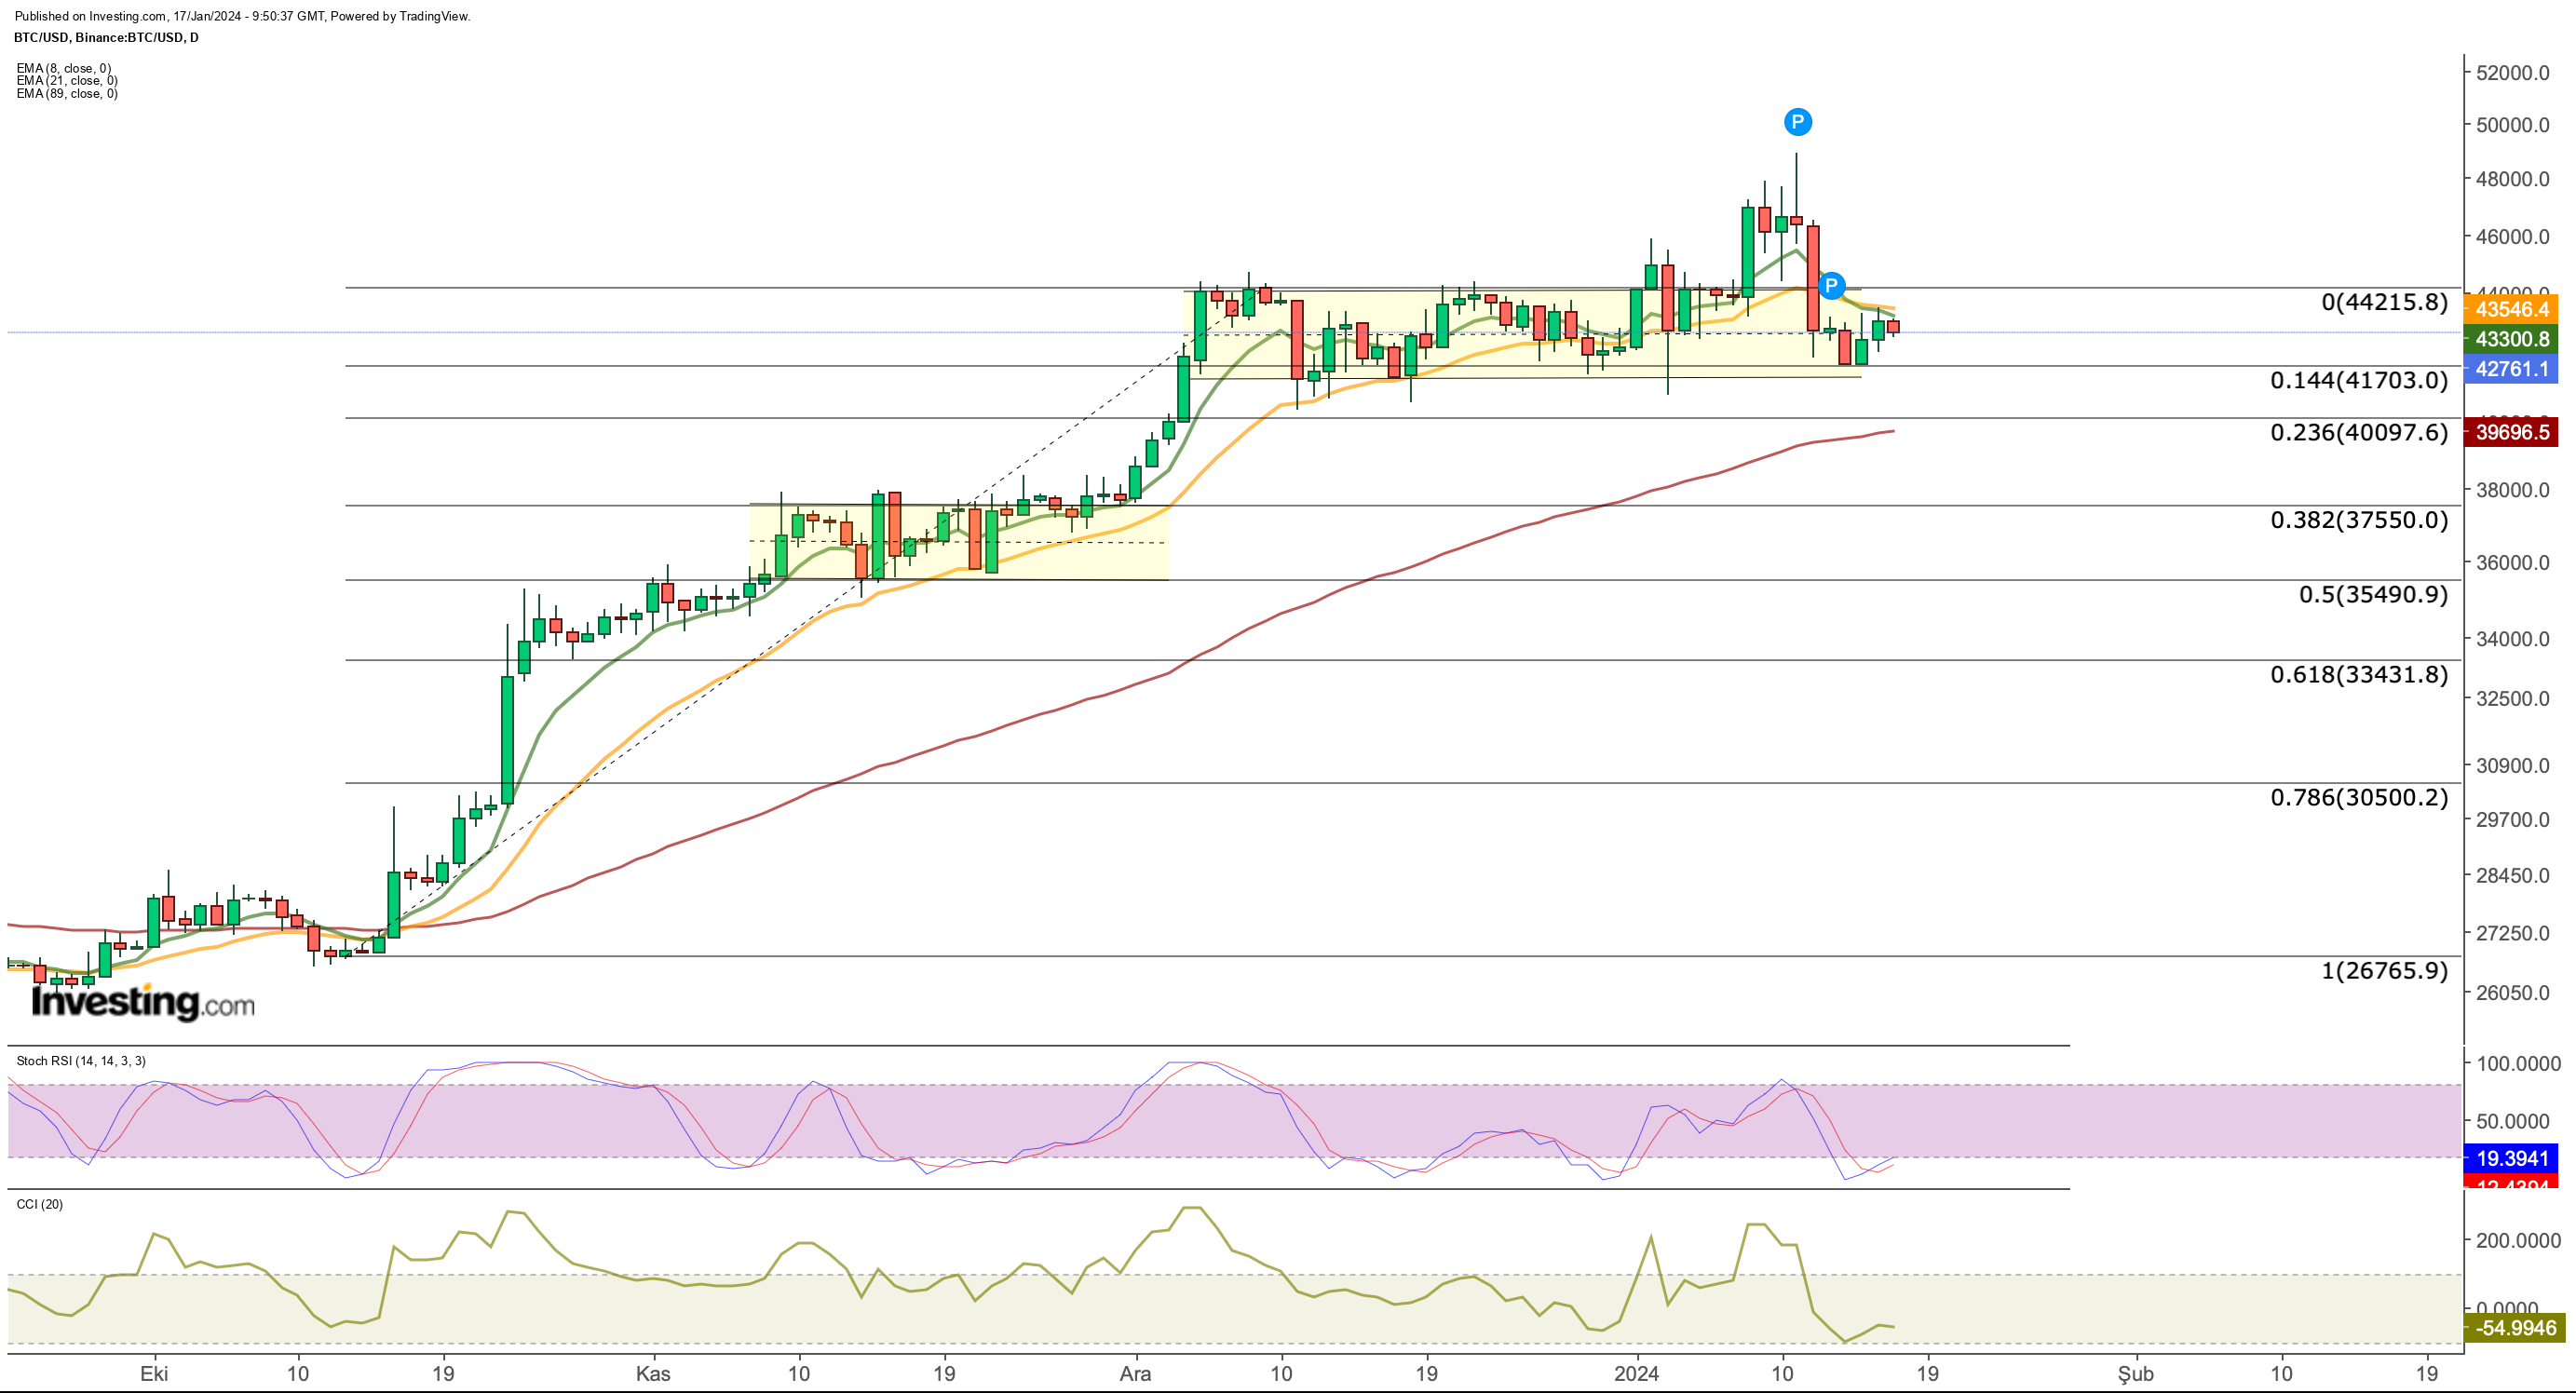
After breaking its sideways trend since December to the upside last week, Bitcoin moved as high as $49,000 following the ETF confirmation but retreated as profit selling accelerated.
Checking the bearish movement, the cryptocurrency found support at the $41,700 band and buyers remained active at the lower band of the current channel. 
In the current situation, it is seen that the intermediate resistance, which corresponds to an average of $ 43,500 in the middle of the week, was tested after maintaining the support zone extending up to $ 41,500 as Bitcoin returned to the band movement.
If the Bitcoin price closes above $ 43,500 for the rest of the week, the more critical resistance price at $ 44,000, the upper band of the channel, will come to the fore.
In this case, a weekly close above $ 44,000 can be followed as the first condition for a new bullish wave to occur.
Exceeding the $ 44,000 resistance in the short term, this time it may appear as a stronger movement than last week's bounce.
Because the Stochastic RSI on the daily chart is generating a stronger buy signal with its current position.
We'll also see Bitcoin move back into positive territory with another 3% rise from its current price, which will be priced above the short-term EMAs.
After another upside breakout of the horizontal channel, the BTC price is more likely to move toward the $50,000 region in the short term.
In the lower region, a break of the $41,500 support could lead the cryptocurrency to test its next support in the $39,000 region.
If this support cannot be maintained, the risk of extending the downward momentum to $ 37,500 and then $ 33,000 will increase.
Ethereum On the Way to $3,000?
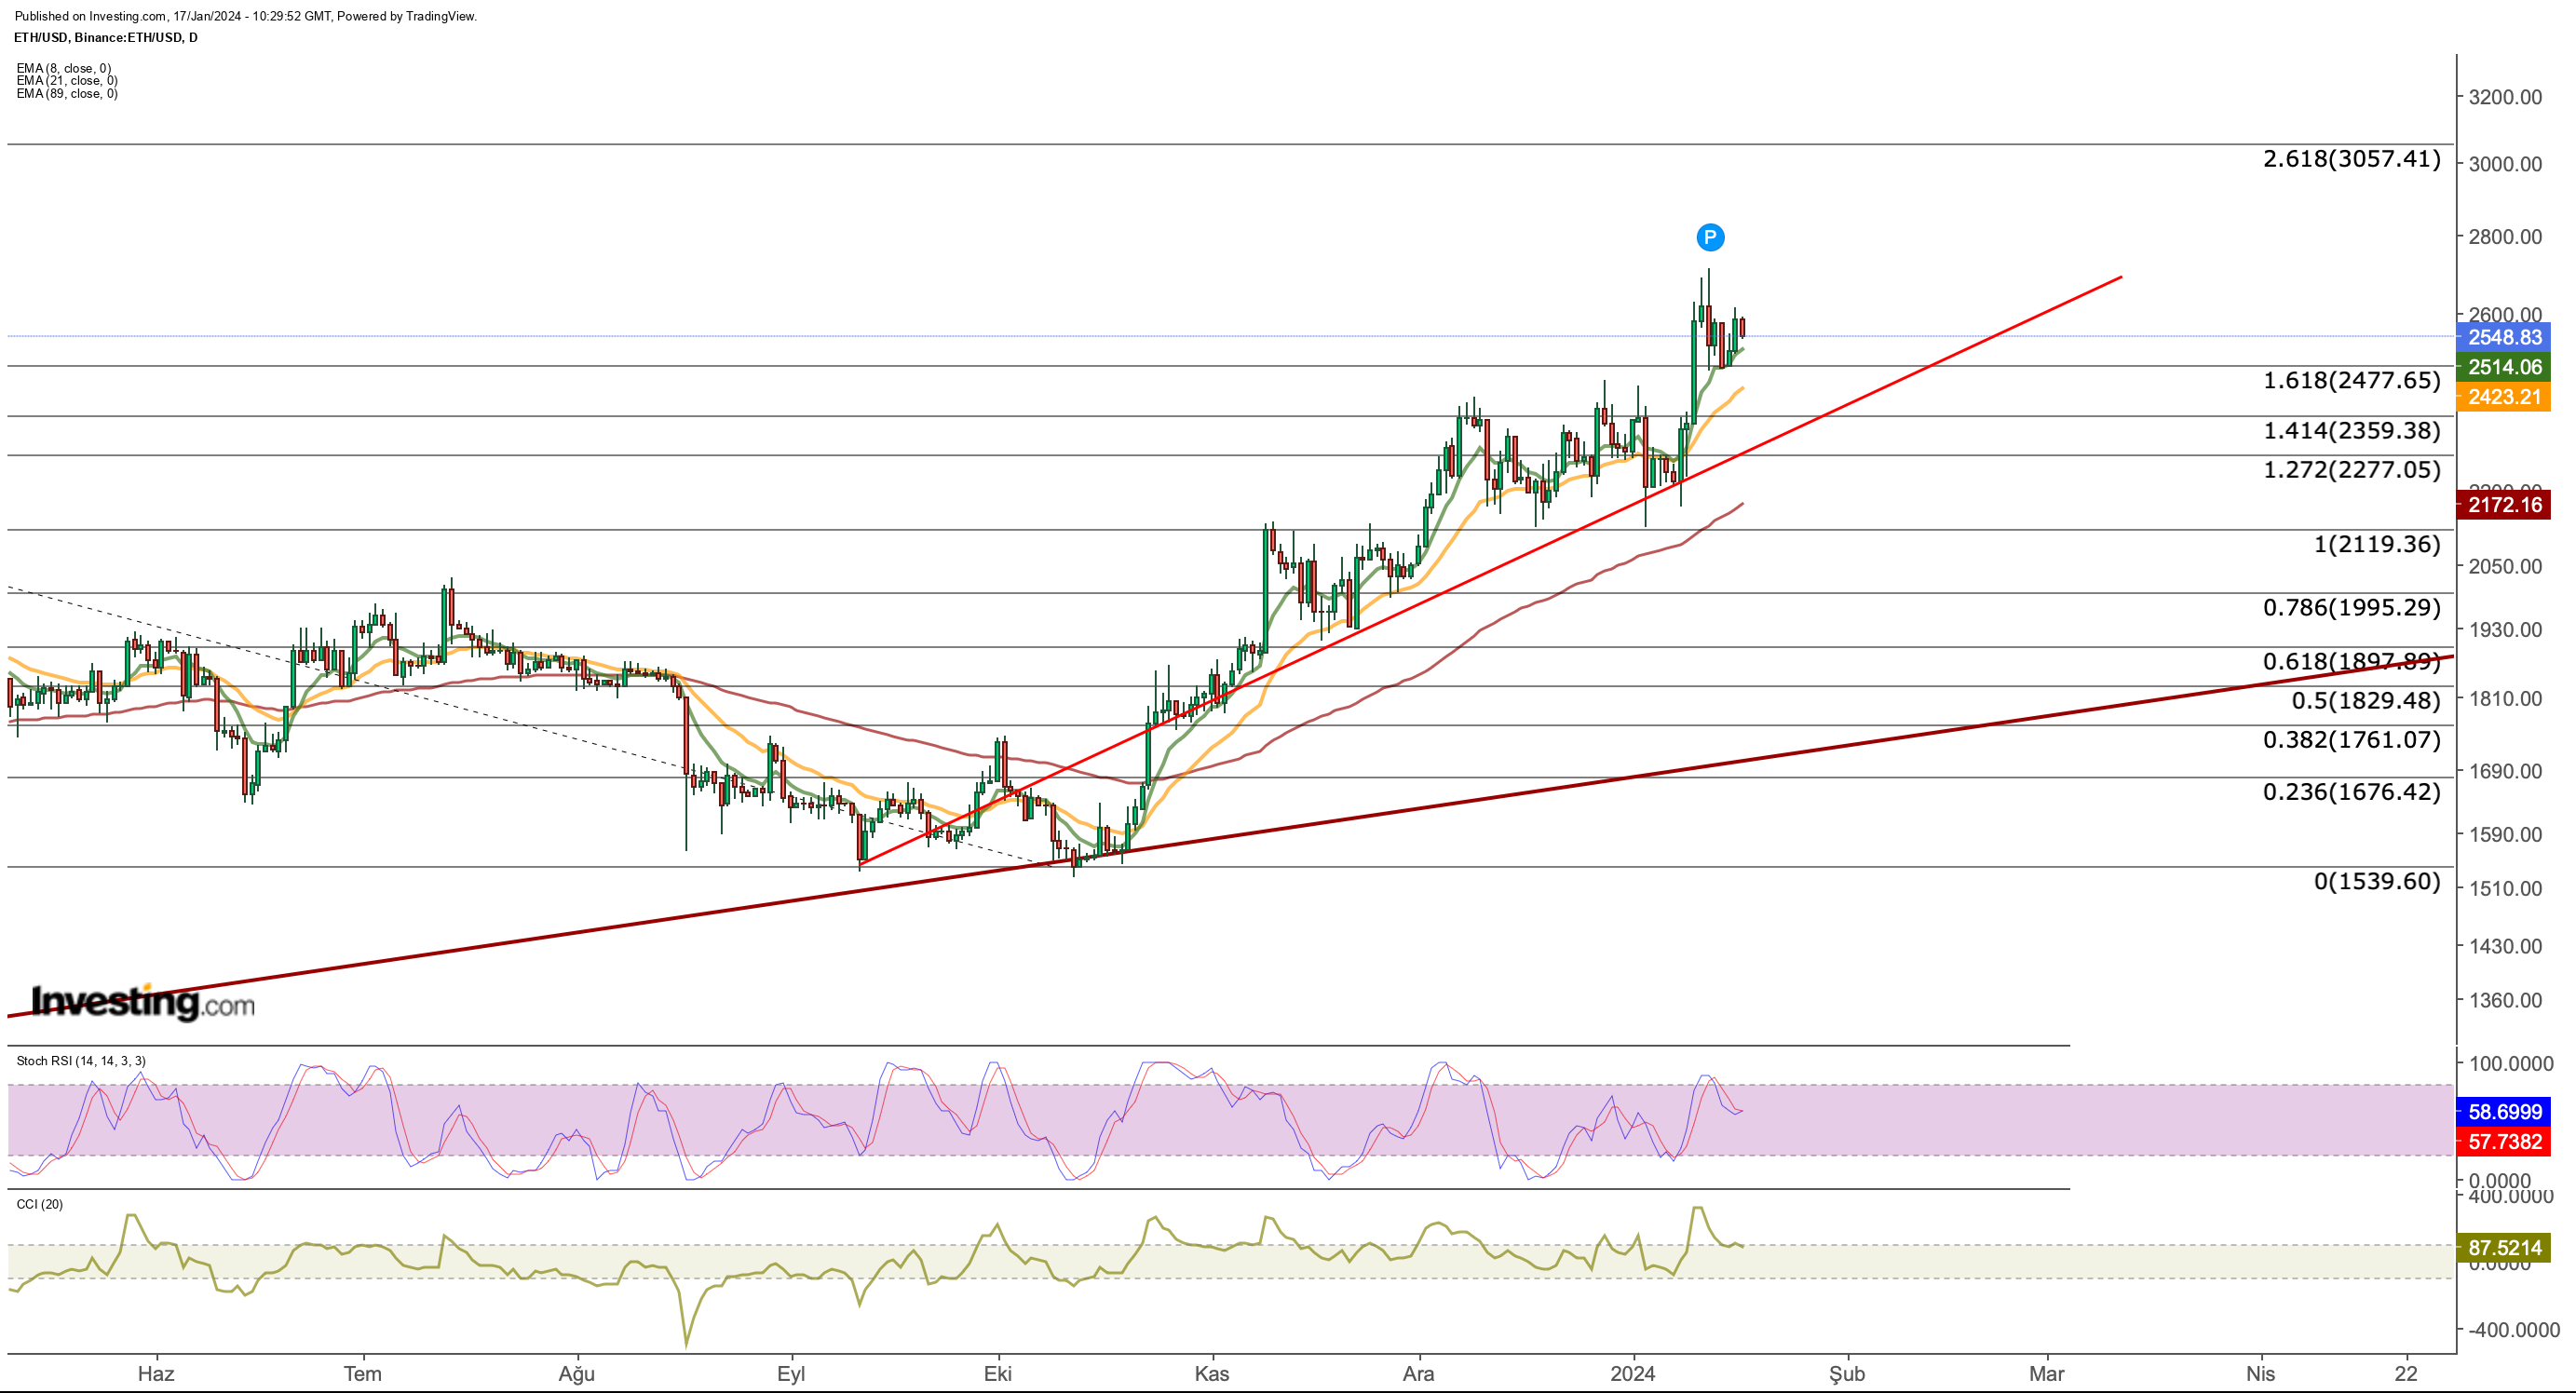
Ethereum quickly passed the critical resistance at $2,470 after a good upward momentum last week, but failed to maintain its trend during the market-wide pullback.
In addition, it was confirmed that Ethereum, which did not lose much in the last downward momentum, turned the $ 2,470 level into support this time.
For cryptocurrency, which turned its direction up again at the beginning of the week, the resistance seen at $ 2,700 may come to the agenda again.
If the $ 2,700 region is retested for the rest of the week, we may see a stronger buying volume this time. This will support ETH's movement towards the psychological price level of $ 3,000.
In the lower region, we follow the support of $ 2,470 as an important price level to keep the trend intact. In a possible breakout, we can see that the range of $ 2,360 - $ 2,270 may form a support line.
Ethereum will maintain its bullish momentum as long as it stays above this region this month. Otherwise, if it stays below the trend originating in October, we can see that the cryptocurrency may start a correction that hangs below $ 2,000.
Bitcoin Cash: Ascending Channel Movement Continues
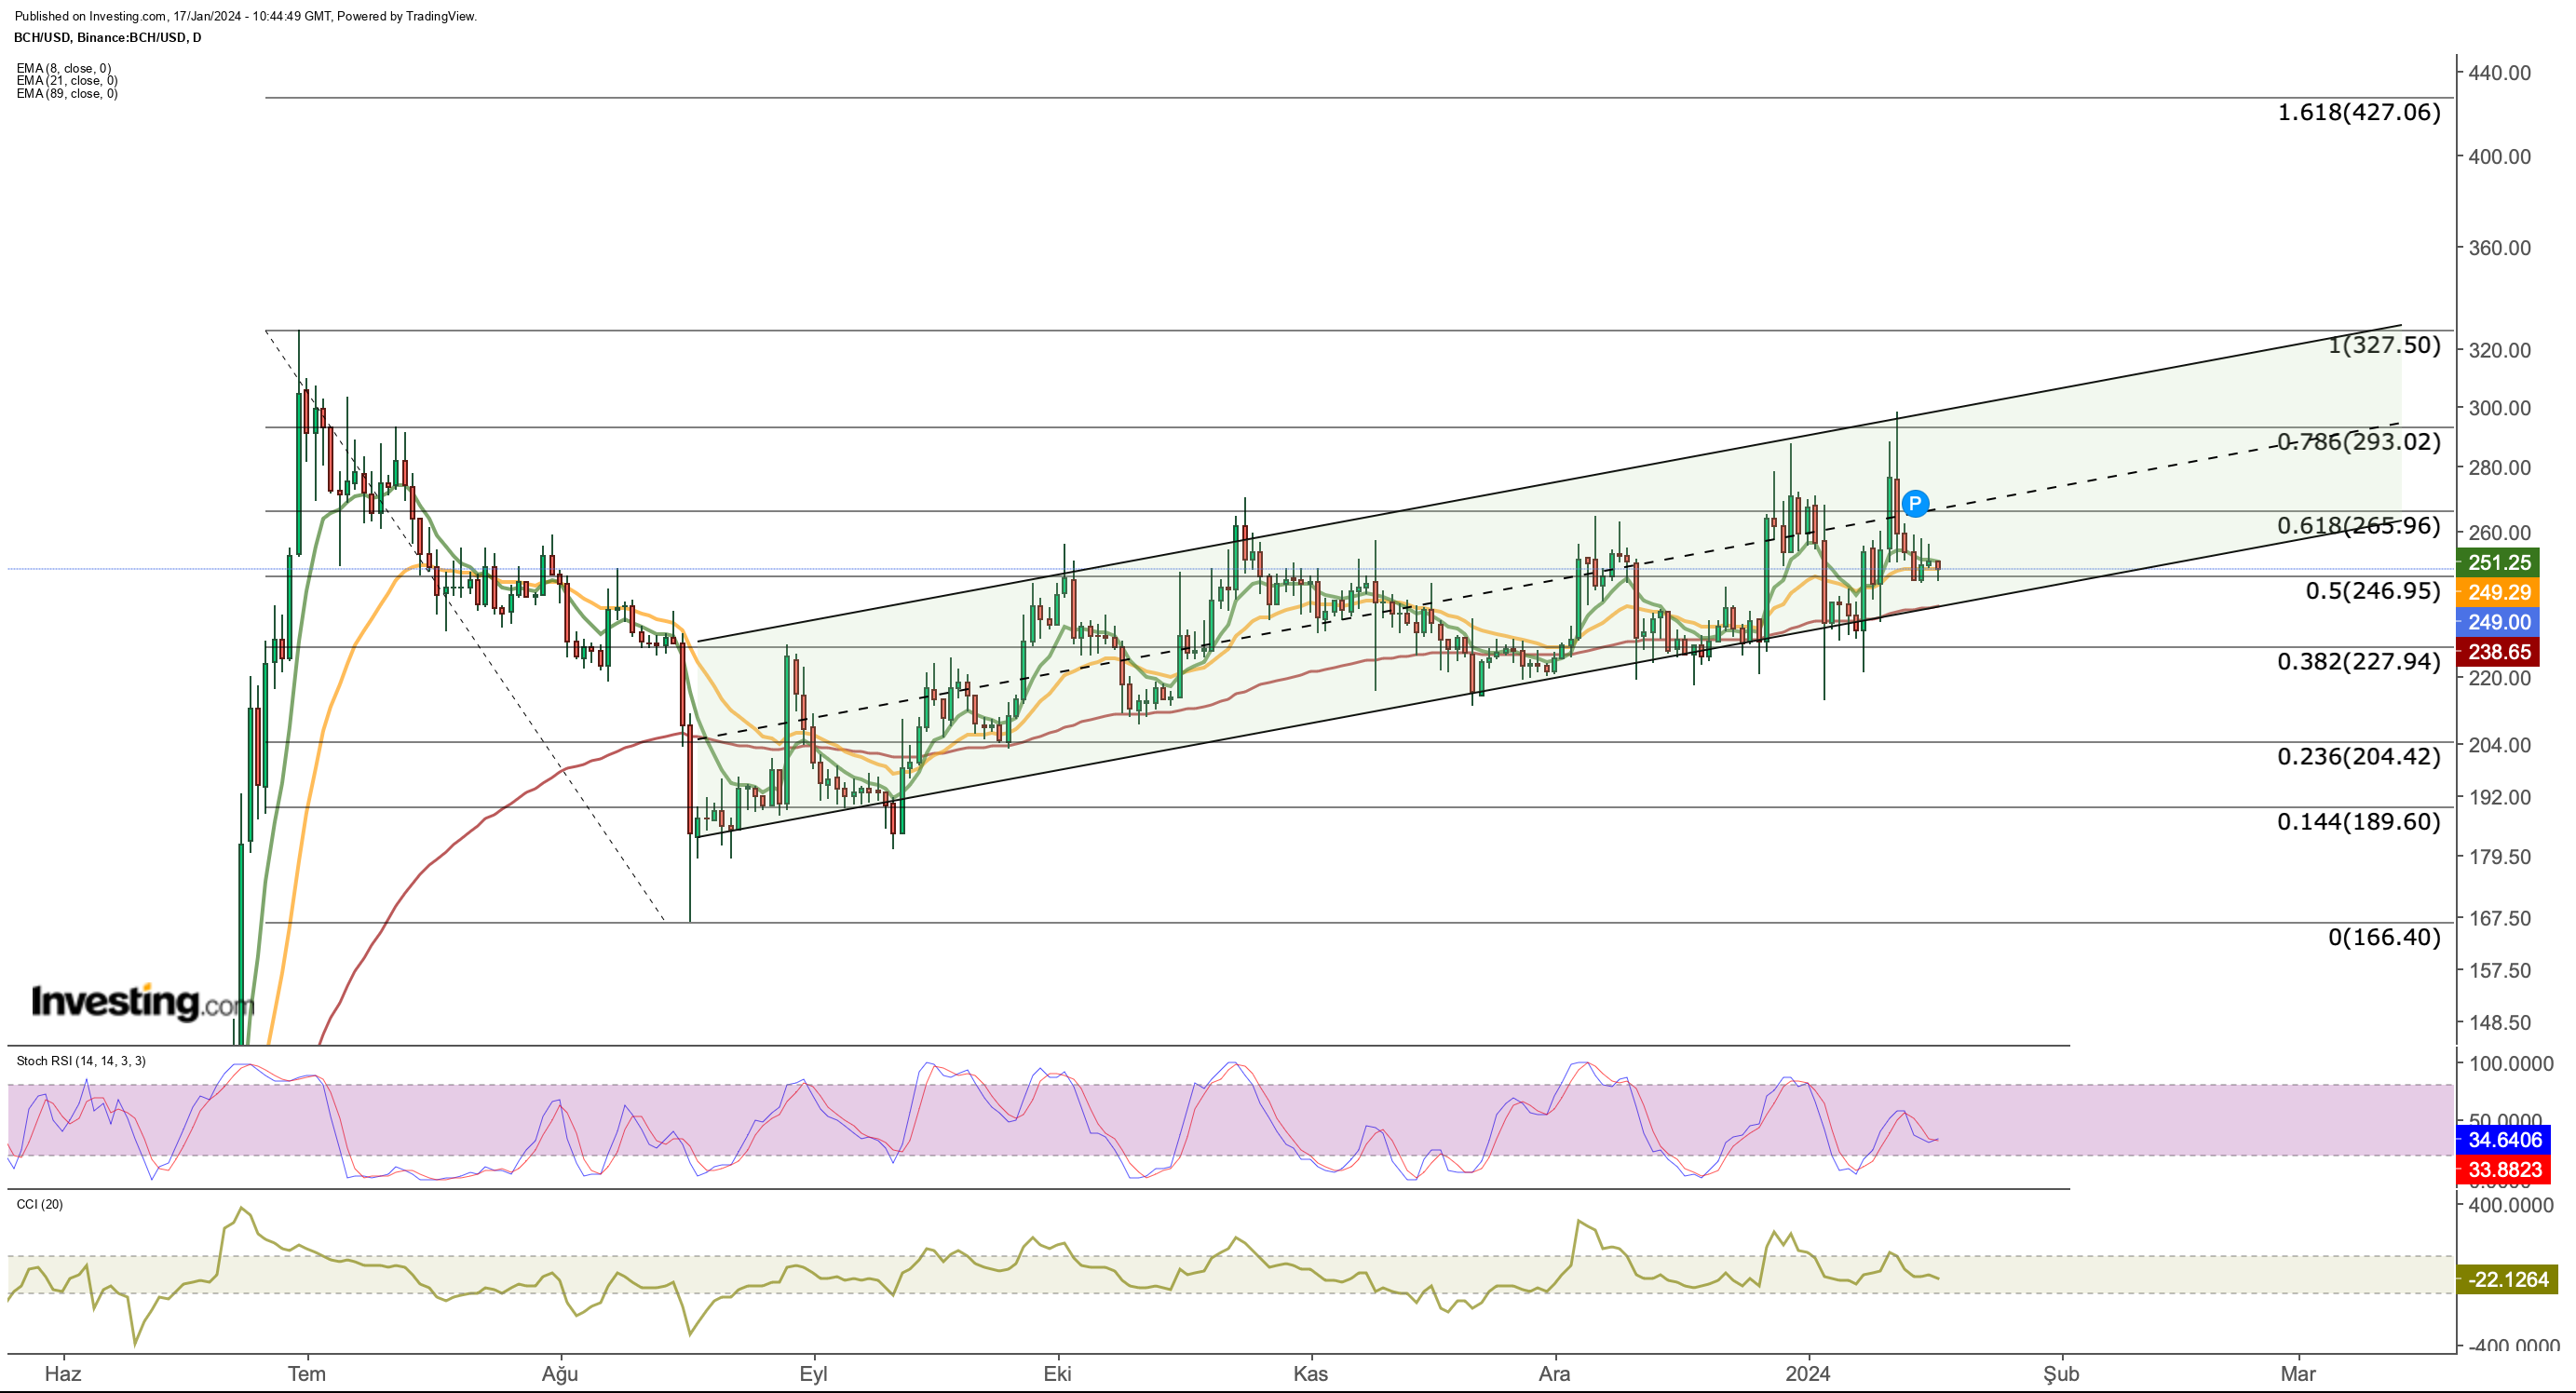
BCH/USD started to move in an ascending channel after finding support in the $ 180 region after the retreat in the June - July period last year. 
Bitcoin Cash, which witnessed volatile price movements from time to time in this process, finally found support in the lower band of the channel at the beginning of the year and reached the upper band with a jump of up to 25% in a short time.
Then, BCH, which was exposed to rapid sales at levels close to $ 300, entered the stage of testing the lower band again this week.
In the current situation, if the average level of $ 240 is accepted as a support for BCH and the oscillation that has been valid since July continues, we can see that BCH may turn its direction up again after retreating towards the range of $ 240 - $ 245.
If such momentum builds the cryptocurrency will once again test the $300 band with a 25% increase in value.
However, looking at short-term past price movements, it is seen that the upward movement occasionally encounters resistance in the middle band of the channel. This could lead to an intermediate resistance in the range of 265 - 270 dollars in a possible reversal.
As a result, BCH has the potential to quickly turn its direction upwards as long as it stays above $240 this week.
If the $240 floor is lost, the rising channel outlook may be disrupted and this time we may follow a downward channel in the direction of $200 and below.
***
In 2024, let hard decisions become easy with our AI-powered stock-picking tool.
Have you ever found yourself faced with the question: which stock should I buy next?
Luckily, this feeling is long gone for ProPicks users. Using state-of-the-art AI technology, ProPicks provides six market-beating stock-picking strategies, including the flagship "Tech Titans," which outperformed the market by 670% over the last decade.
_____________________________________________________
Investing Pro Subscribers are the first to receive breaking news, analyst upgrades, and best buy ProPick recommendations. For an extra 10% discount, use Coupon: Canada2024. Don’t miss the New Year’s sale, for up to 60% off. Only until Jan 31st.
Disclaimer: This article is written for informational purposes only; it does not constitute a solicitation, offer, advice, or recommendation to invest as such it is not intended to incentivize the purchase of assets in any way. I would like to remind you that any type of asset, is evaluated from multiple points of view and is highly risky and therefore, any investment decision and the associated risk remains with the investor.
