The foreign exchange (forex) market is the largest and most liquid financial market in the world. Currency exchange-traded funds (CETFs) provide exposure to the forex market, enabling portfolio diversification as well as speculation. There are a wide range of funds covering different currencies as well as both long and short (inverse) position ETFs and double and triple (i.e., leveraged) long and short funds.
Research highlights:
"The key features of FX, such as minimal trading costs, 24/7 trading opportunities, high transactional transparency and liquidity, have favored its widespread acceptance across the globe."
According to NASDAQ (NASDAQ:NDAQ), in the forex market, "More than $5 trillion are traded on average every day. By comparison, this volume exceeds global equities trading volumes by 25 times."
Most of the transaction occurs between institutions. As a trading center, London accounts for more than 40% of the total activity, "while the combined share of the top four trading centres, which also include New York, Singapore and Hong Kong SAR, amounts to 75% of global FX turnover."
Metrics show:
"The major currency pairs that are traded include EUR/USD, USD/JPY, GBP/USD and USD/CHF. The most popular forex market is the euro to US dollar exchange rate (EUR to USD), which trades the value of euros in US dollars."
Today, we will introduce a currency ETF that provides exposure to the British pound sterling (GBP).
The Pound Sterling Has Been Volatile
Seasoned investors would concur that predicting currency exchange-rate moves is difficult and potentially a risky strategy. Foreign exchange movements depend on several, often unpredictable, macro-economic factors.
The pound is the official currency of the United Kingdom (UK). It is also referred to as the pound sterling (£, GBP). Each pound is divided into 100 pence.
A currency rises or drops relative to other FX peers. When headlines say the pound is weak (or strong), that weakness (or strength) is in reference to other major currencies. For instance, the pound could drop (or rise) in value relative to the US dollar while remaining steady versus other currencies.
Following the June 2016 Brexit referendum result, the pound fell hard. The value of sterling relative to the US dollar went from about $1.47 to $1.22 in just five months after the vote.
Similarly, the early days of COVID-19 brought strength for the US dollar and weakness for the pound. On Mar. 18, 2020, sterling plunged, falling below 1.15, a level not seen in decades. However, since the summer, the cable has rebounded. Now, as we write, the rate is hovering at 1.40.
The pound’s recent move upward is a combination of both the recent weakness in the US dollar and the strength in the pound. The value of a currency is typically driven by interest rates, economic developments as well as national and global politics.
After the Brexit referendum in 2016, the pound also fell sharply against other currencies, especially the euro. On June 22, 2016, the pound was about 1.30 to the euro. But in November 2016, it was about 1.16. Then, in late March 2020, the pound was hovering around 1.08 against the euro. The current rate is around 1.16.
During the final days of 2020, the UK and the European Union (EU) finalized a trade deal, days before the end of the transition period following the Brexit vote. With the lifting of the uncertainty, the pound got a boost. Recent weeks have also witnessed a UK-wide vaccine rollout, leading to optimism that the British economy might go back to pre-coronavirus level in the coming quarters.
Let's now take a look at our currency ETF.
Invesco CurrencyShares British Pound Sterling Trust
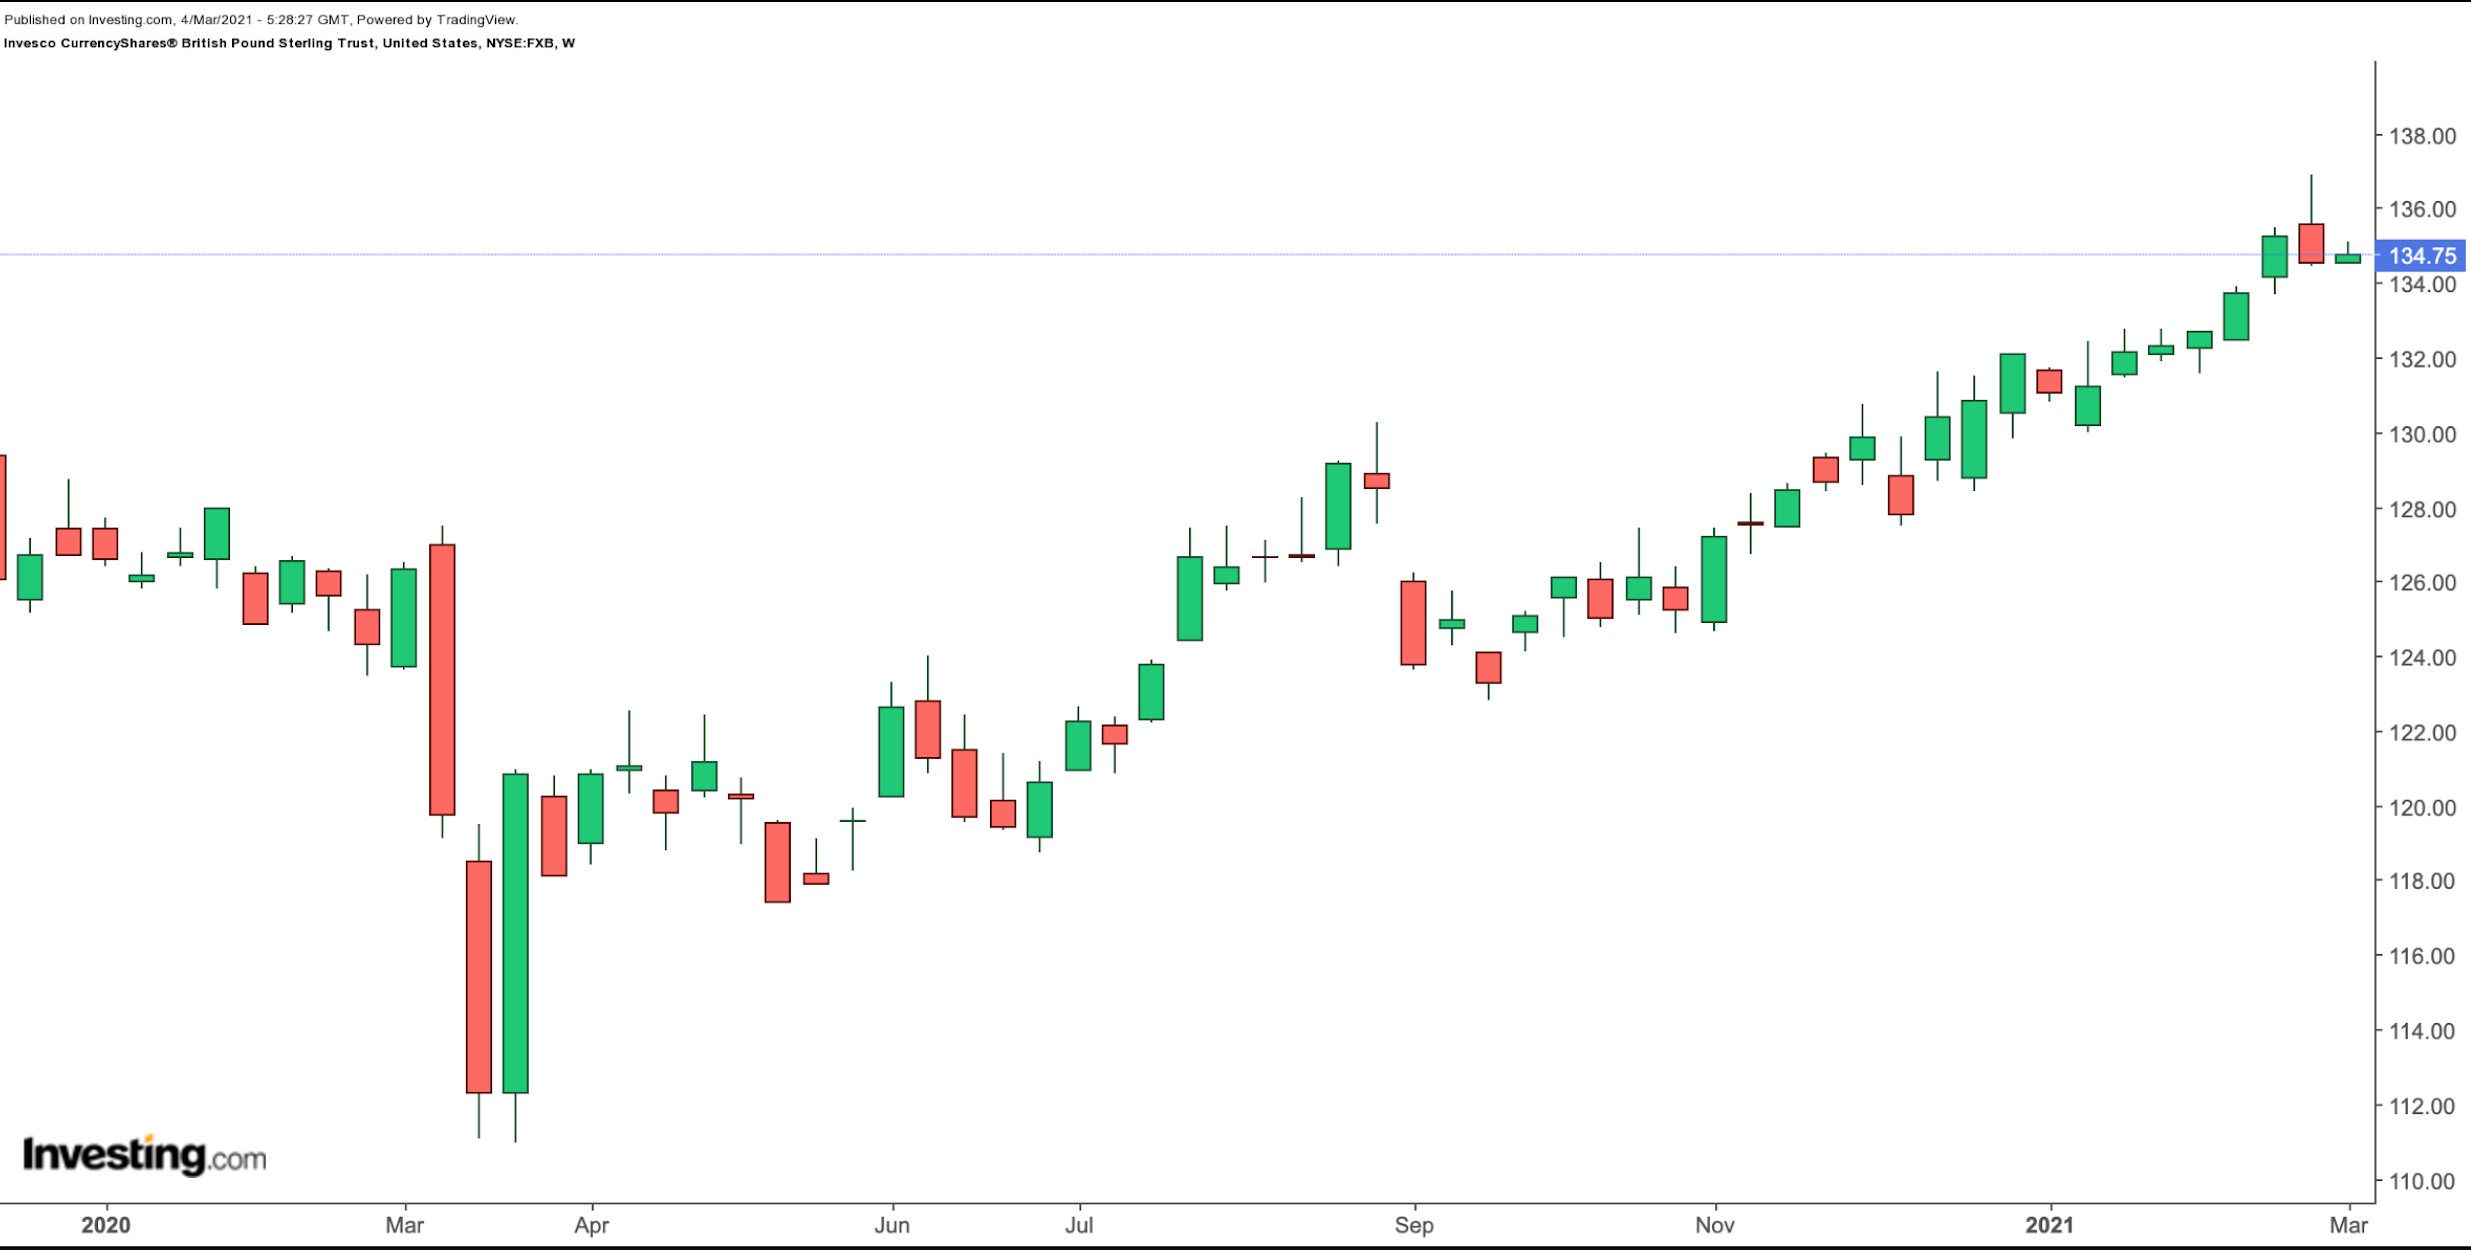
Current Price: $134.75
52-Week Range: $110.96 - $136.88
Expense Ratio: 0.40% per year
The Invesco CurrencyShares® British Pound Sterling Trust (NYSE:FXB) tracks the price of the British pound sterling against the US dollar. The issuer holds physical pounds on deposit at JPMorgan Chase (NYSE:JPM). FXB started trading in June 2006. Its benchmark index is the WM/Reuters British Pound Closing Spot Rate.

It is a liquid CETF that makes it easy to bet on the direction of the pound. So far in the year, FXB is up close over 2%. During the past year, it has returned almost 9%.
The key, near-term highlight for the British pound is the budget for 2021, revealed by Chancellor of the Exchequer Rishi Sunak on Mar. 3.
So what could be the next move for the pound against the USD?
The current level is expected to act as major resistance. Therefore, side moves as well as occasional pullbacks should be expected. We’d look to buy FXB in the case of a decline toward $133.5 or lower. Similarly, the recent rally against the euro could also stall in the coming weeks as profit-taking kicks in.
Finally, we should note that there tends to be a positive correlation between the moves in the pound and the broader US indices over the long term. Put another way, the pound fares better when US markets do well.
A final point would be the pound tends to appreciate vis-à-vis the US dollar when volatility is low. We recently covered the VIX, or the benchmark for US stock market volatility.
