Key Points:
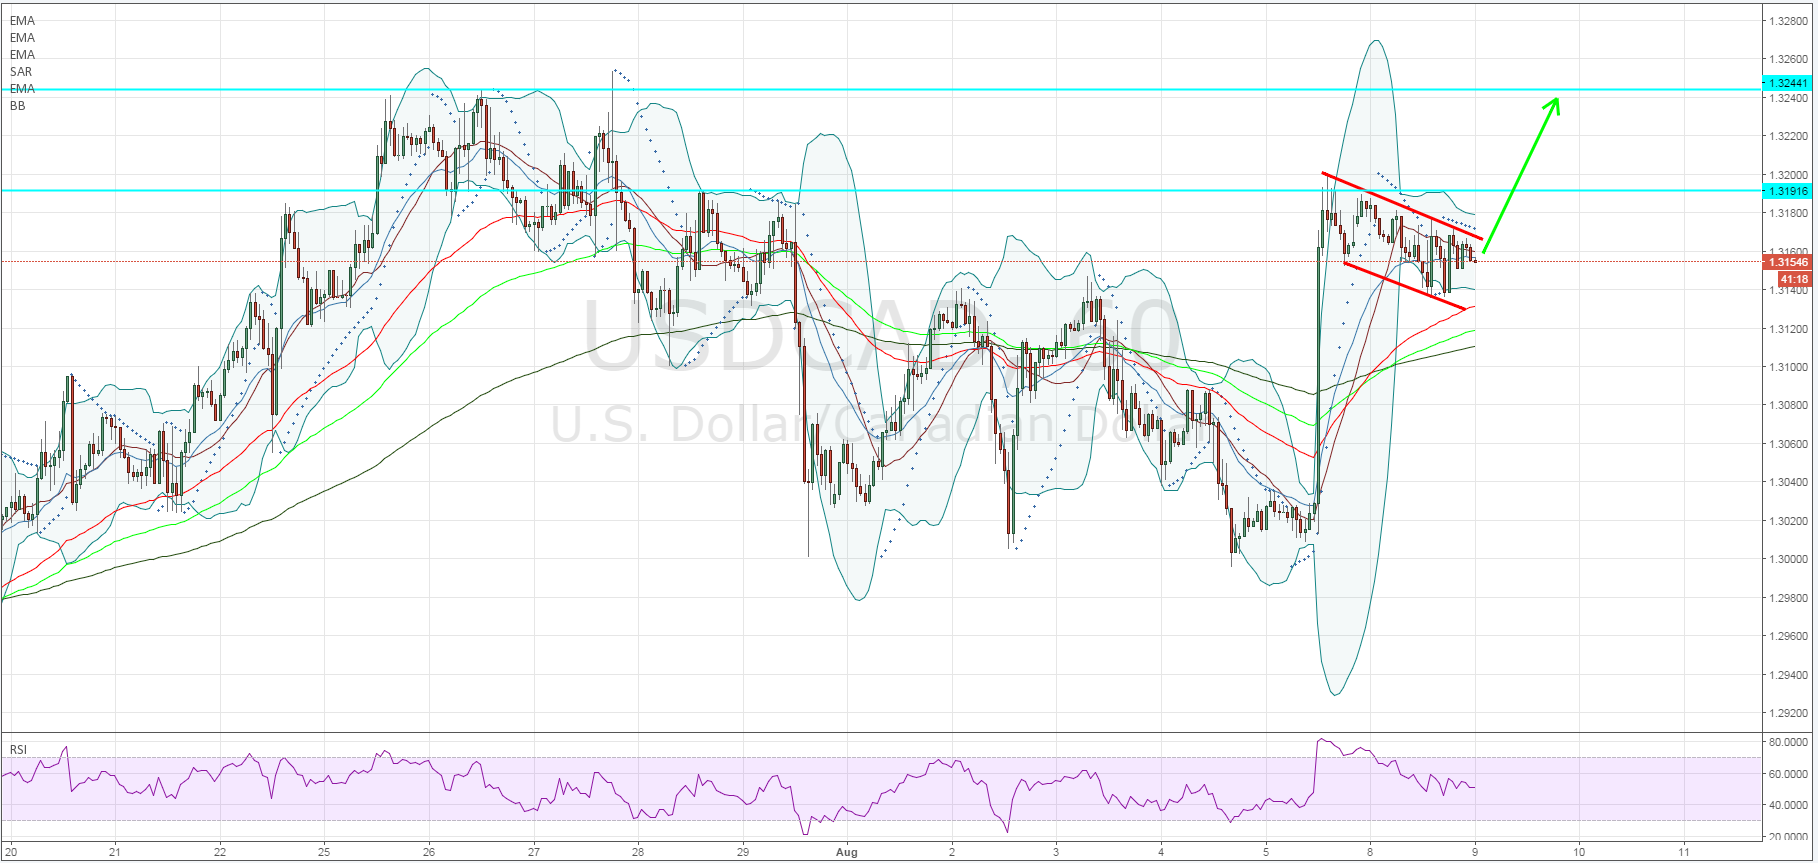
- USDCAD forms bullish flag on 1-hr chart.
- RSI Oscillator declines from overbought territory.
- Market largely underestimating risk of US FOMC rate hike.
The USDCAD pair has been under pressure over the past few days despite the stronger than expected US Labour market figures from Friday last week. In fact, the pair has steadily declined, in an impulse wave format, after failing to break through the 1.32 handle. However, the recent declines have formed a bullish flag which could potentially set the pair up for another attempt at the 1.32 resistance point.
From a technical analysis perspective, the post-NFP rally—which took the pair towards the 1.32 handle—has broken the current down trend and set the pair up to probe higher. This also coincides with the appearance of the bullish flag which has relieved some of the overbought pressure and allowed the RSI to fall back into neutral territory. The Bollinger® bands have also started to tighten around the price action indicating that a decisive move could be coming.
Subsequently, there are plenty of technical reasons to see a continuation of the bullish trend, which commenced last week, and a further challenge of the 1.32 handle. Any upside move would likely target the 38.2% Fibonacci retracement level at 1.3311 where I would suggest being extremely cautious of any further upside potential in the short term. A more conservative short term reversal point would be around the 1.3244 mark where previous swing highs are likely to set the tone.

In addition, there are plenty of fundamental views floating around that seem to suggest that the markets have largely under-predicted the risk of a single rate hike from the US Federal Reserve in the coming months. This particular school of thought revolves around the fact that the stronger NFP result of last week might just tip the central bank’s sentiment towards a hawkish move. Obviously, any move in this direction would see the greenback appreciate strongly against the CAD, however, at this juncture a rate hike still appears unlikely.
Ultimately, the pair is likely to break higher towards the 1.3244 mark in the short term and possibly through to the 38.2% Fibonacci level at 1.3311 in extension. Subsequently, watch the pair closely in the coming session for a breakout of the bullish flag’s upper constraint to time your entry. However, do monitor some of the US fundamental data swirling around this week as any one of those results could rapidly shift market sentiment.
