
This content was originally published on Market Pulse, the newsletter that tells you what you need to know about Canadian Real Estate in 2-3 minutes.
Interest Rates & Inflation
CPI numbers in September came in 3.8%, down 0.2% from the scary 4% in August.
Last week the Bank of Canada once again paused interest rates and the prime rate still sits at 7.2% with the overnight lending rate at 5%.
Where do rates go from here?
If you talk to some realtors and economists at the big banks, they’ll tell you the BoC is going to start cutting rates by the first quarter of 2024.
Others think that inflation hasn’t been completely weeded out and both the U.S. and Canada will continue to keep elevated rates at least until 2025.
Not many believe rates will go any higher than they are now, citing that the current rates are already wreaking havoc on household economics and real estate.
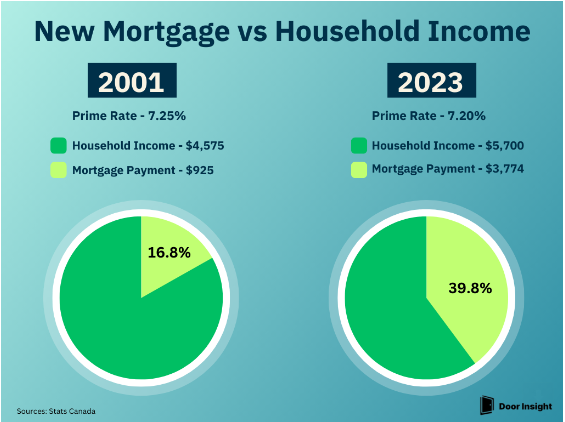
Mortgage Payments - 2001 vs Today
2001 was the last time we saw rates this elevated. At that time, if you were to get a mortgage, the average mortgage payment would be $925 assuming you got the prime rate of 7.25%. With rates at 7.2% today, your mortgage payment would be $3,774.
The graphic below shows the percentage make-up of that mortgage payment for households comparing 2001 and 2023. This data is the average for all of Canada. In places like Toronto and Vancouver, the percentage of mortgage payment is closer to 50% in 2023.
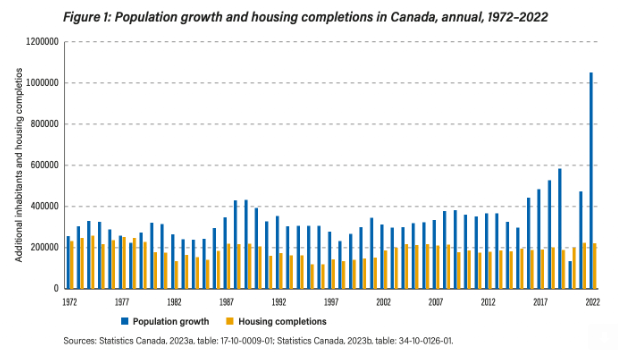
Population vs Housing Completions
A research report by Fraser Institute looked at the relationship between annual population growth and housing starts from 1972 to 2022 and found the following:
Throughout most of this period, Canada’s population grew by one to three people for every housing unit completed.
In 2022, population grew by 4.7 people for every unit completed the previous year—higher than at any other time.
The Government Cut Of Construction
An informative report from a year ago highlights the % share that governments take in a few major census metro areas in Canada. It found that government fees on construction in Montreal are more than 50% less than in Toronto or Vancouver.
The graphic below shows the average government charge per square foot averaged out among all dwelling types. The difference between Montreal and the other two is substantial.
In many cases, up to 20% of constructions costs could be allocated to government fees. The study goes in depth to understand what the fees account for and bring awareness to make sure we remove hurdles from building more supply.

Residential Rent Update
You can now see monthly rent action in major cities across the country with our Rent Stats Dashboard. See rent trends since the past year broken down by dwelling types.
