A busy day/night for central bank meetings with the Bank of Canada tonight, into the Reserve Bank of New Zealand tomorrow morning. Throw in some Australian RBA board members speaking and the general endless commentary around the Federal Reserve and there is plenty to keep up with!
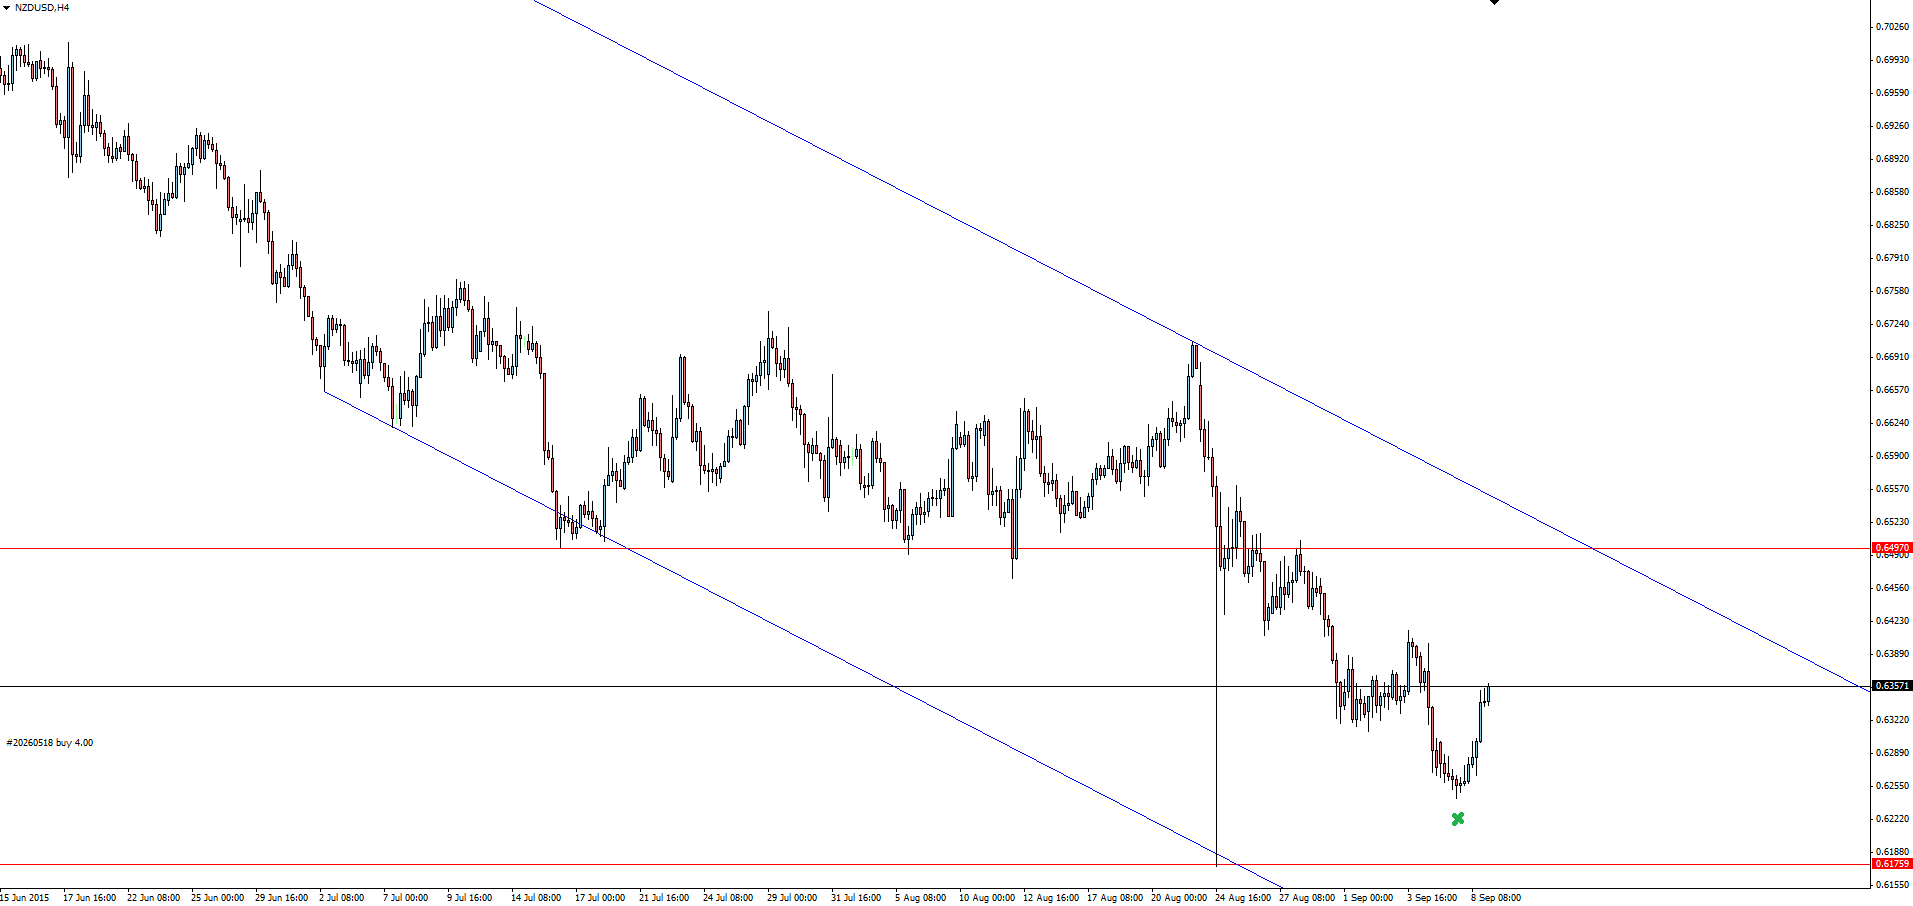
We took a look at the RBNZ Interest Rate Decision yesterday, expecting a cut to be all but priced in and the possible trading opportunity of buying into the expected cut.
NZD/USD 4 Hourly:
Even with fairly ugly Chinese Trade Balance numbers hitting markets yesterday afternoon, the kiwi has kept focus on the bigger picture and started the week rallying off lows. An alternate explanation is that these Chinese numbers have all but assured a fresh round of stimulus, sure to give the commodity currencies that extra kick. Put this all together and it was certainly a nice entry if you got on board early!
Take a look at the USD/CAD technicals in the Chart of the Day section below.
Dangers of the Dead Cat Bounce:
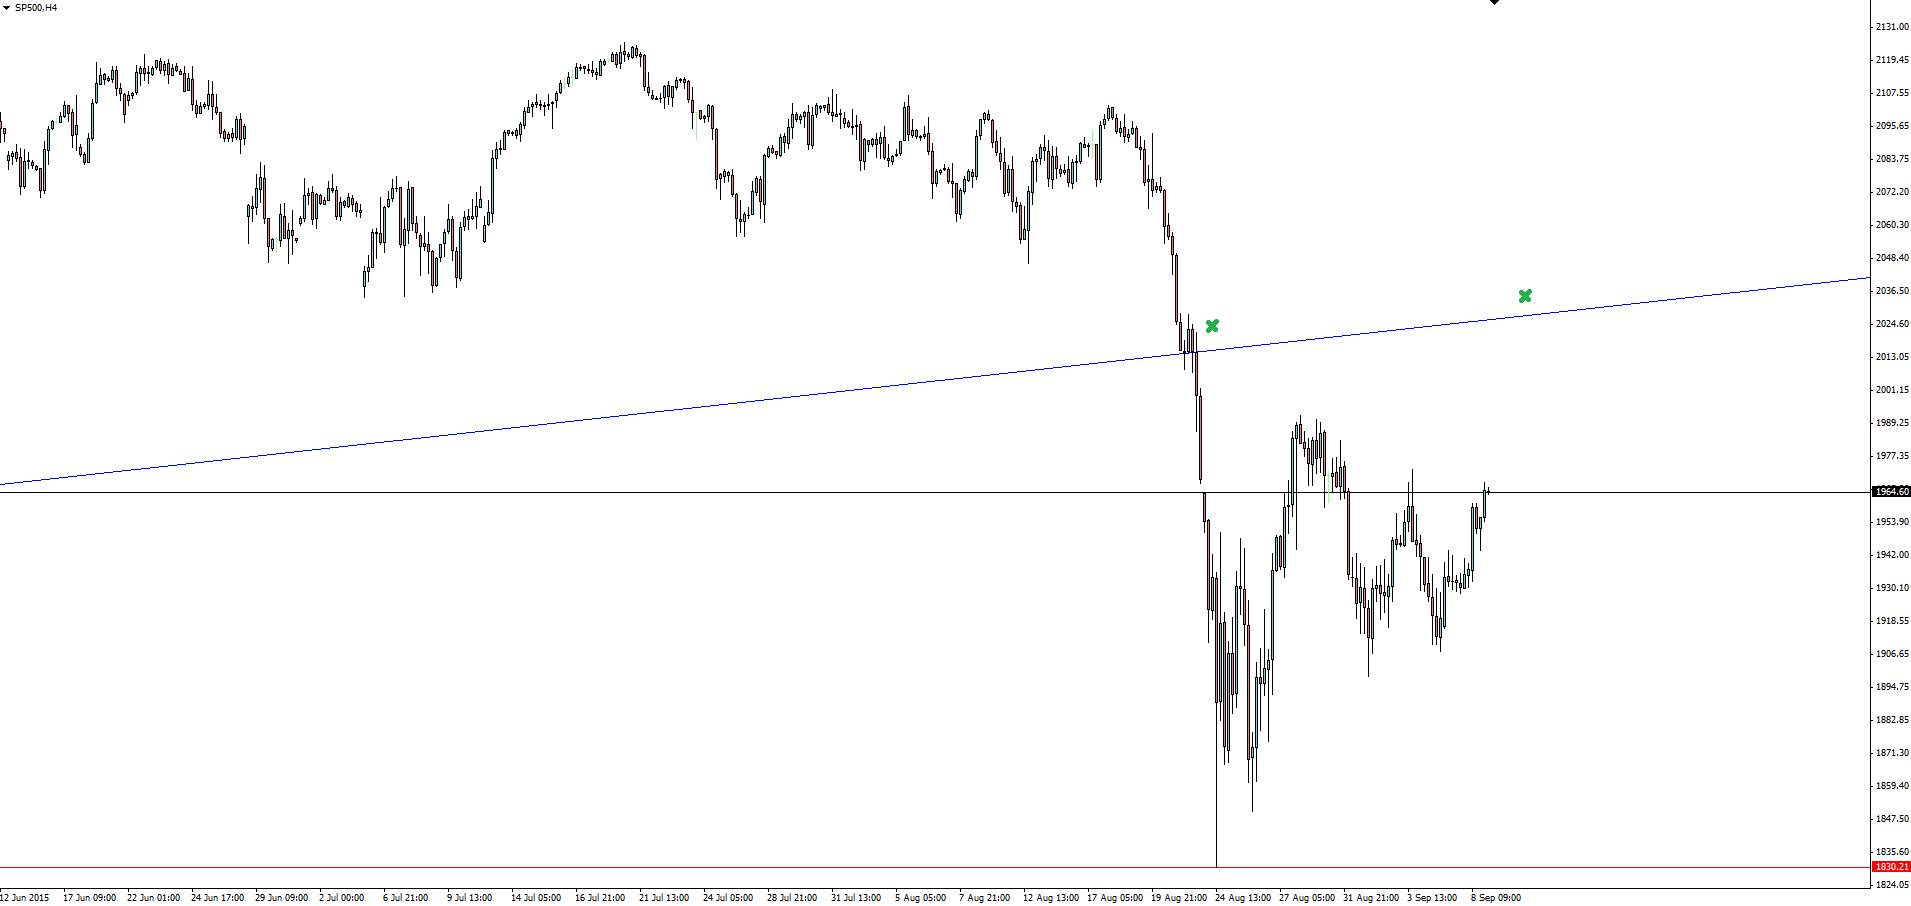
With the US market returning from the 3 day, Labor Day long weekend holiday, stocks made broad gains with the S&P 500 gaining more than 2% and continuing the march back towards a re-test of the broken major weekly trend line.
The most interesting piece I came across this morning was this BloombergView piece from Barry Ritholtz titled Don’t Trust the Market’s Big Up Days.
“22 of the 25 biggest S&P 500 up days since 1970 occurred within overall downtrends.”
Dead cat bounces are always intriguing to analyse from a human psych point of view.
Just a word of warning for those that love to ‘buy the dip’.
On the Calendar Wednesday:
AUD: Westpac Consumer Sentiment
AUD: Home Loans m/m
AUD RBA Deputy Gov Lowe Speaks
GBP: Manufacturing Production m/m
GBP: Trade Balance
AUD: RBA Assist Gov Debelle Speaks
CAD: Building Permits m/m
CAD: BOC Rate Statement
CAD: Overnight Rate
USD: JOLTS Job Openings
Chart of the Day:
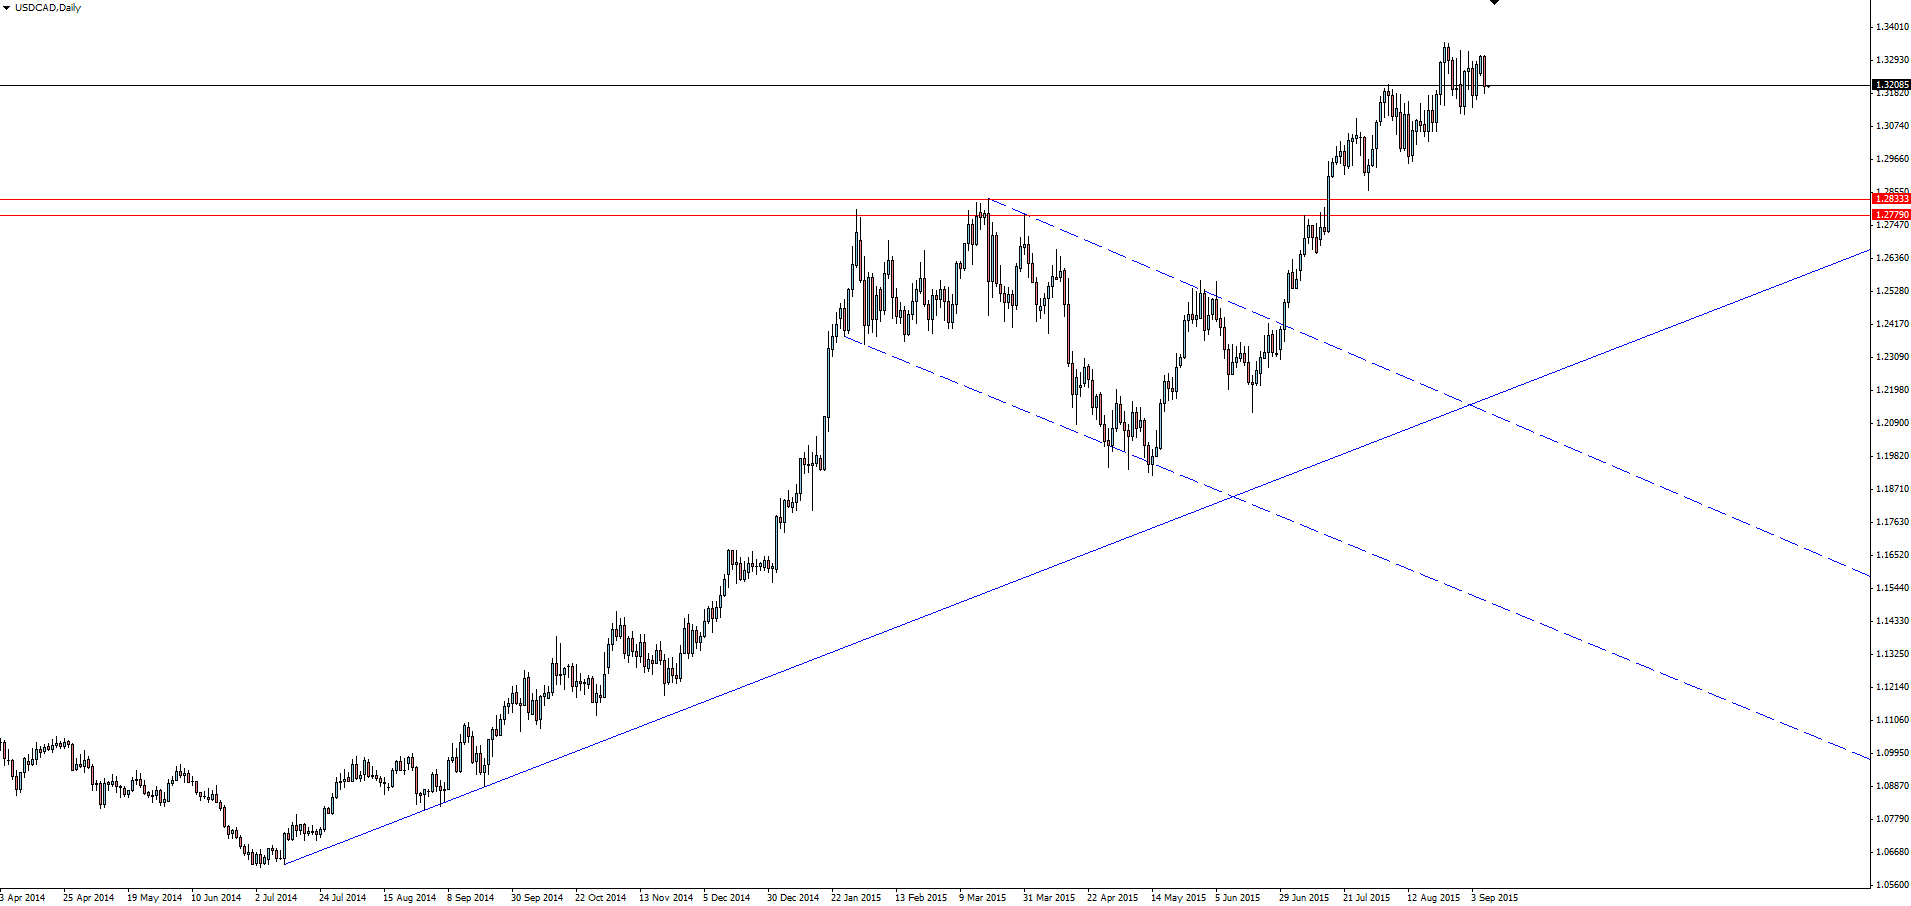
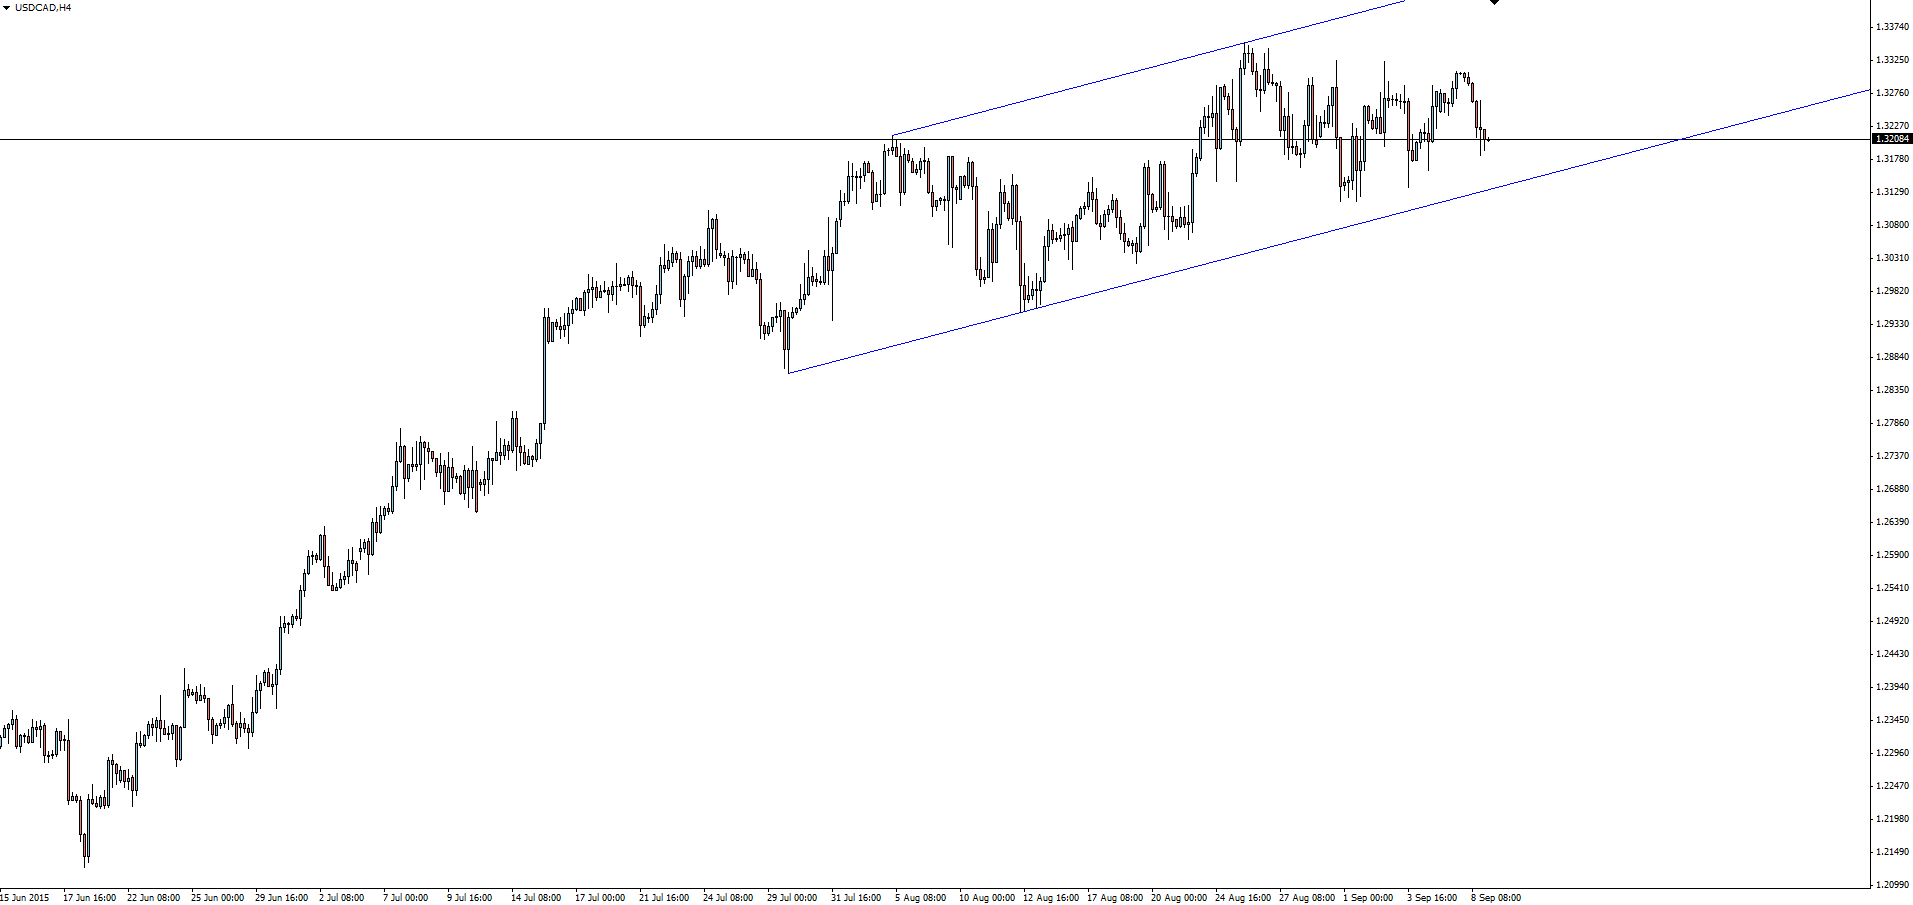
With the Bank of Canada interest rate decision tonight, let's take a look at USD/CAD from a technical perspective.
The daily chart is a perfect illustration of why picking tops because a chart looks overbought is dangerous. In this last 1200 pip up leg, you could have put forward a case that the chart was running out of steam day after day.
Risk Disclosure: In addition to the website disclaimer below, the material on this page prepared by Vantage FX Pty Ltd, does not contain a record of our trading prices, or an offer of, or solicitation for, a transaction in any financial instrument. The research contained in this report should not be construed as a solicitation to trade. All opinions, news, research, analyses, prices or other information is provided as general market commentary and marketing communication – not as investment advice. Consequently any person acting on it does so entirely at their own risk. The experts writers express their personal opinions and will not assume any responsibility whatsoever for the actions of the reader. We always aim for maximum accuracy and timeliness and Vantage FX shall not be liable for any loss or damage, consequential or otherwise, which may arise from the use or reliance on the service and its content, inaccurate information or typos. No representation is being made that any results discussed within the report will be achieved, and past performance is not indicative of future performance.


