This post was written exclusively for Investing.com
Gold has been in consolidation mode for the last three weeks or so, following its recent big gains. But the precious metal is now ready to potentially resume higher, as it remains supported from both technical and fundamental viewpoints.
Fundamentally, the biggest drivers behind gold prices have been the weakness in the US dollar and falling bond yields, amid all the central bank largess. And following the Fed’s decision on Thursday to have a more relaxed approach on inflation, in an effort to stimulate growth, interest rates are likely to remain low even longer now.
This should be—and is for now—providing renewed weakness for the dollar, which explains why gold was up again this morning, along with the likes of the EUR/USD while the USD/CAD was falling towards its 2019 lows.
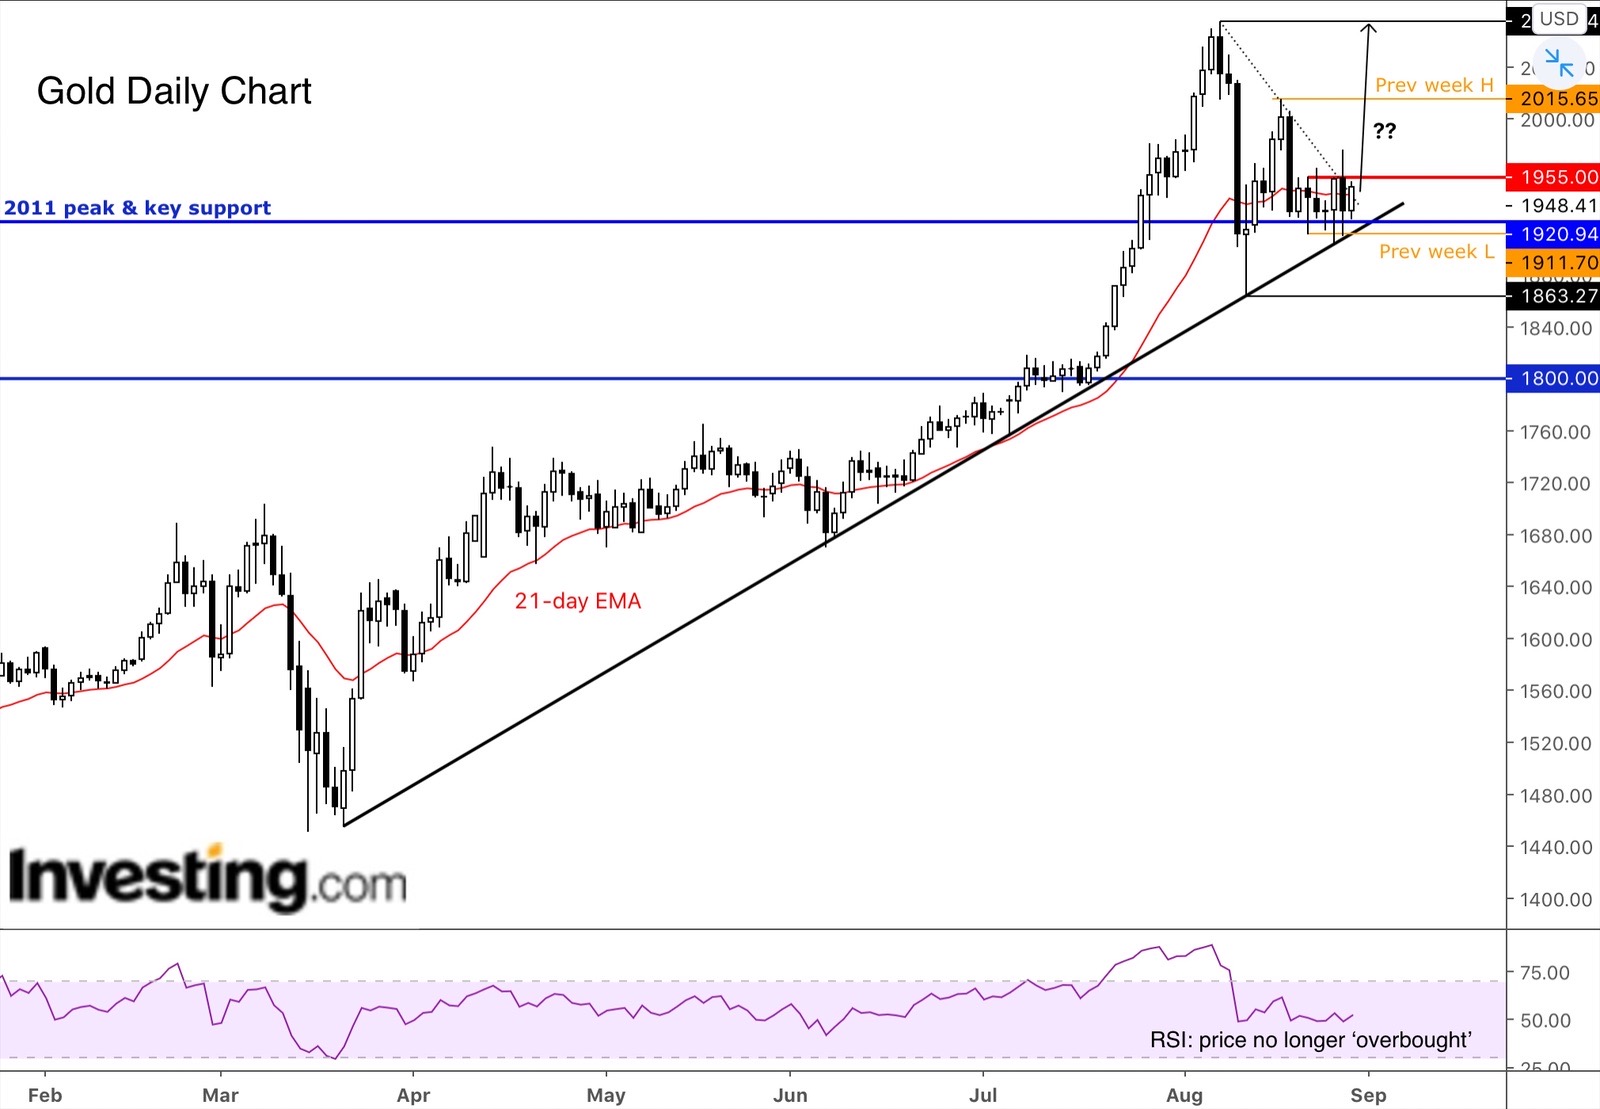
From a technical point of view, we have seen a few signs to indicate gold is gearing up for another push higher. The daily chart for example shows the precious metal is holding its own above THIS key bullish trend line:

What’s more, the dips back below the previous all-time high made in 2011, at around $1920, have been short-lived so far. Once strong resistance, this $1920 level is now the most important support for the bulls to defend to keep the short-term bullish bias alive. So far, they are doing a good job at that.
Meanwhile, gold’s momentum indicators such as the RSI have worked off their ‘overbought’ conditions, mainly through time (i.e. consolidation) rather than price action (i.e. a big sell-off). This is potentially bullish as it indicates the bulls have not given back too much ground, for if they had it would have indicated that the sellers were more in control of price action. Thus, the recent weakness may well have been driven by long side profit-taking rather than short-selling.
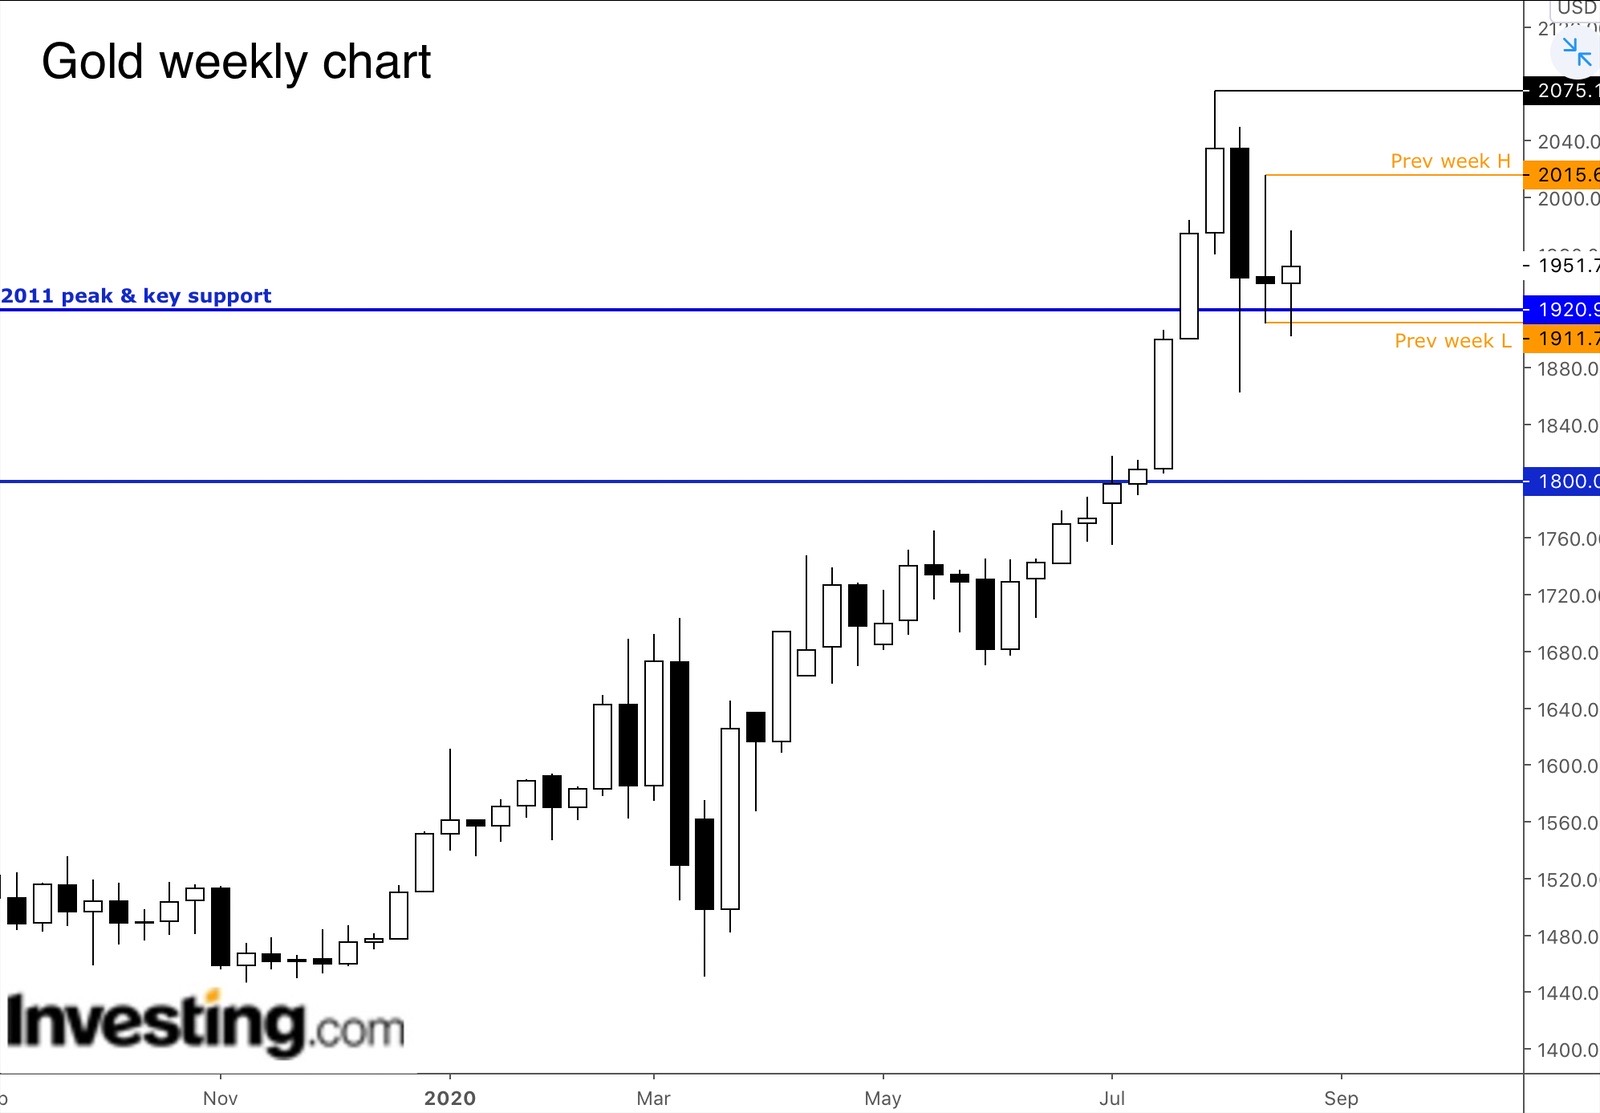
Indeed, zooming out to the weekly, the recent weakness looks very small compared to the gains the bulls have enjoyed. In fact, the weekly chart also shows a potential bullish formation, namely an inside bar failure pattern:

Following last week’s inside bar formation, gold attempted to break below the low of last week’s range as it triggered a bunch of stop sell orders that were presumably resting beneath it. However, it now looks like the sellers may have been trapped there as price is currently back well above last week’s low.
Thus, if that’s the case, then it is likely that some of those speculators who traded on the weekly time frame will have their stop loss orders placed above the high of last week’s inside bar candle around $2016. With the markets being a function of liquidity, that’s exactly where I am expecting gold to head towards in the coming days.
But potentially we could even see a new all-time high for gold in the not-too-distant future given a still positive fundamental backdrop. For that to happen sooner, we don’t want to see a decisive break below the key support area mentioned above (i.e. around $1920). If that happens then expect a deeper correction as it would invalidate the short-term bullish bias.
