The US dollar is falling again today, for the third straight session. The fundamental drivers for this current decline are difficult to pinpoint.
It could be Fed Chief Jerome Powell's remarks on Friday at the Jackson Hole symposium reiterating the Fed's outlook for the US economy to continue growing, with interest rates rising at a gradual, albeit steady, pace. Traders have fully priced in a higher interest rate for next month's meeting. However, it's possible the subtext to Powell's remarks, which signaled reduced odds of a fourth hike this year, might be weighing on the currency.
Another possible negative fundamental event for the dollar: US President Donald Trump yesterday saying that this isn't the right time to negotiate with China on trade. Whatever the cause, the dollar is slipping, in the process triggering multiple technical signals.

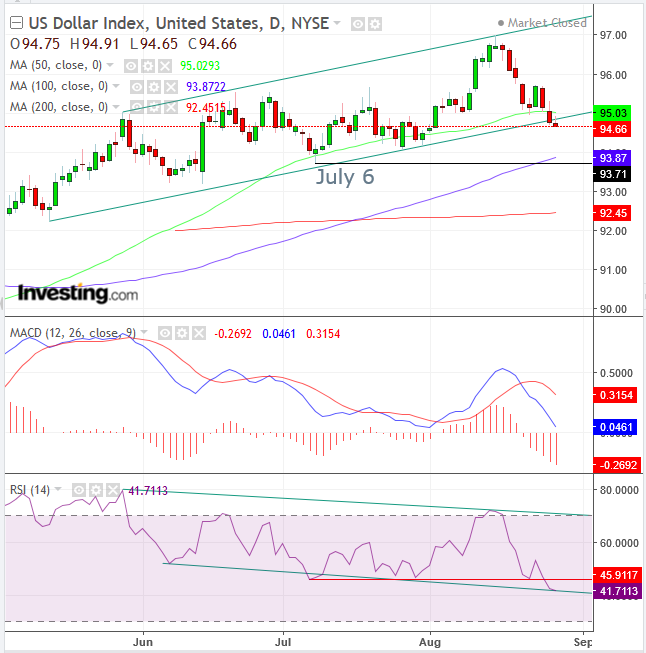
The Dollar Index extended its decline after falling below its uptrend line since May 14 and a rising channel since May 30. When the global reserve currency crossed below the uptrend line/channel bottom, it also fell below the 50 DMA (green), after the MA provided support for four sessions.
The unsuccessful MA support, followed by the failed uptrend line, demonstrates that supply overwhelmed and finally drowned demand. The ongoing decline is the result of sellers continuing to reduce their asking price, in order to find willing buyers.
Should this momentum endure, sellers would continue to lower their asking price, as they grow increasingly desperate to liquidate their holdings. Short sellers would exacerbate the supply-demand balance, increasing pressure on the US currency.
The increasing momentum for a falling dollar may be seen in two different ways via the RSI. The clearer signal is the indicator falling below its 45.9 support since July 6, suggesting prices may also fall below their July 6 low of 93.71.
The second, less conspicuous signal, is a negative divergence. Notice that while the price data advanced within a rising channel, momentum fell within a descending channel at the same time. This weakness in energy has provided a heads up that bulls would run out of steam.
As well, the MACD provided a sell signal when the shorter MA crossed below the longer MA, when recent prices underperformed earlier ones.
Trading Strategies - Short Position Setup
Conservative traders should wait for an official trend reversal, with two descending peaks and troughs, after prices fall below the July 6 trough.
Moderate traders might risk a short position if prices rally back to 95 and find resistance, with at least one long red candle following a green or small candle of any color.
Aggressive traders may risk a short position, providing they prepare an equity management plan that suits their overall individual needs and achieves a minimum risk-reward ratio of 1:3.
Trade Example:
- Entry: 94.50
- Stop-loss: 95.00, psychological round number
- Risk: 50pips
- Target: 93.00, above the July trough
- Reward: 150 pips
- Risk-Reward Ratio: 1:3
