Yesterday's API US oil inventories report showed a significant drawdown, a decline of 5.42 million barrels, the sharpest weekly plunge for the metric since August. If today's official, EIA government report confirms the drop, which is forecast to come in lower with a -2.835 million-barrel decline, but is, nonetheless a positive figure, why is WTI currently heading lower?
The price of crude has been falling for the past six hours. It might be because of increasing concerns of escalating COVID-19 cases on the European Continent, which is leading to renewed social restrictions and outright lockdowns.
That could certainly add to the narrative, but it wasn't the initial impetus for today's descent since even the latest negative news, that Germany is seeing a record number of outbreaks, was released after the slide had already begun.
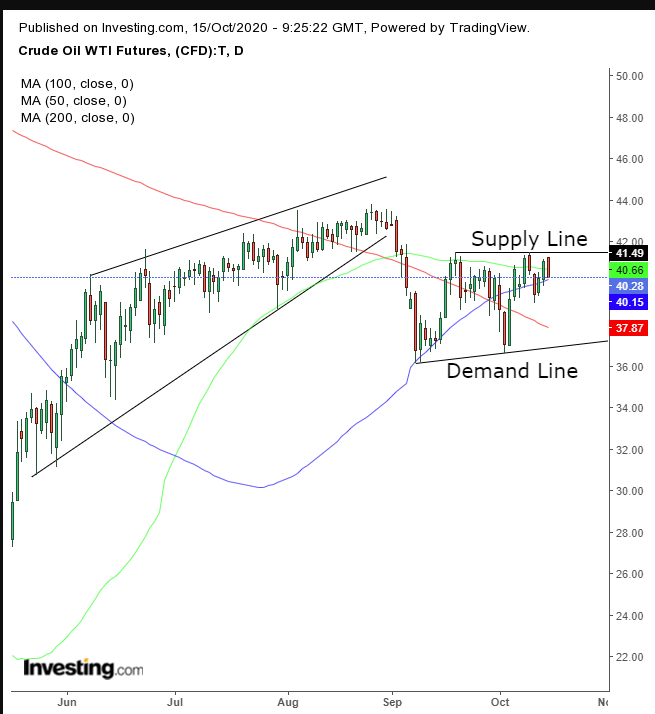
So what's driving oil's downward trajectory? Fundamentals may be murky, but technicals are showing the momentum forces of supply and demand causing the price to plummet.

As indicated by the two preceding declines in the month, the $41+ level is a clear resistance.
Note, the 50 DMA—a source of support for the preceding range—turned sour after failing to produce a rally. It joined the resistance at $41+ level, the top of a range.
The momentum still has the 100 DMA rising, however. Notice that it’s the only moving average that is rising, as it's still within the medium term’s velocity, the upmove from the sub-$40 levels in April.
The 50 DMA is falling with the price from the $43 heights and the previous range. The 200 DMA never had a chance to attempt to pick itself up. It has been slipping since the October 2018 highs of $76.
The fact that the price has been falling, even before the recent negative news about the virus, underscores the importance of the price level. Given that it is the top of a range, there are good odds that the price will revisit its bottom on momentum alone, as sell orders push the price lower, triggering additional sell orders, and so on repeatedly. The next significant demand may appear toward the bottom of the range, around the mid-$30s.
Nevertheless, the range is likely to fail to maintain support, following the preceding bearish rising wedge. Either which way, the proximity to the top of the range affords traders an ideal entry from a risk-reward perspective.
Trading Strategies
Conservative traders should wait for the price to close at these lower levels to demonstrate that sellers have more power at these levels. Then, they would do well to wait for the price to retest the resistance, before coming to a short position.
Moderate traders may also wait for a return move, for a better entry, if not further resistance confirmation.
Aggressive traders would short at will, according to their trading strategy, provided they understand the risks. Here’s an example:
Trade Sample
- Entry: $41 – upon a corrective rally
- Stop-Loss: $42 – round number above range
- Risk: $1
- Target: $38 – whole number above range bottom
- Reward: $3
- Risk:Reward Ratio: 1:3
Which stock to consider in your next trade?
AI computing powers are changing the Canadian stock market. Investing.com’s ProPicks AI are winning stock portfolios chosen by our advanced AI for Canada, the US, and other exciting markets around the globe. Our top strategy, Tech Titans, nearly doubled the S&P 500 in 2024 - one of the most bullish years in history. And Beat the TSX, designed for broad market exposure, is showing +878% gains with 10 years’ back-tested performance. Which Canadian stock will be the next to soar?
Unlock ProPicks AI