Alphabet (NASDAQ:GOOG) is due to release its Q1 results after market close. Analysts expect the parent of search-engine giant Google to report EPS of $10.53 on revenue of $37.3 billion. The expected EPS is significantly lower than the $13.33 EPS posted for the same quarter last year, while the expected revenue for this quarter is dramatically higher than the $31.15 billion posted last year. The company consistently beat earnings last year, while its revenue-beat uptrend has been running 11-quarters strong.
The question on traders’ minds must be whether Alphabet’s profitable investments are enough to overshadow the risk of gargantuan EU fines, after it was assessed 1.49 billion euros ($1.7 billion) in March, its third large European Union antitrust penalty in two years, for blocking websites from using ad brokers other than its own AdSense platform.
The answer, however, is not clear, and neither is the internet behemoth's chart. The shares (Class C) are up almost 23% since the New Year, and closed up 0.7% at $1272.18 on Friday. Will they rise further or will they slide? With an uncertain view from both fundamental and technical analysis, we'd advise treading carefully for now.

Chart powered by TradingView
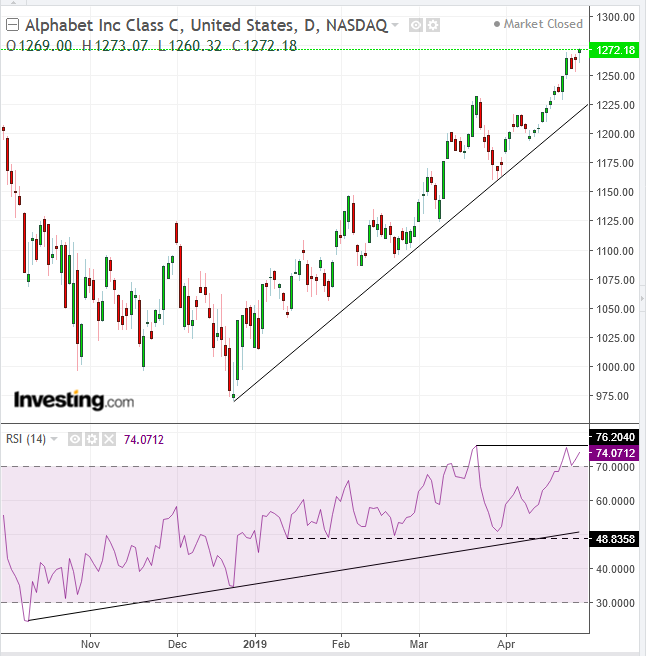
The share price managed to climb out of a hole and post a gain on Friday. The trading pattern, however, formed a hanging man, a set-up for a bearish play after pushing to a record close.
The RSI has fluctuated after reaching overbought levels in the mid-70s. Moreover, the RSI provided a negative divergence when it failed to rise above its March 21 highs, while the price bested its highs of the same period by more than 3%.
This momentum weakness opens up the potential for an RSI double top on the daily chart, which may drag the price below its uptrend since the December selloff. The RSI double-top may also give a heads up to another double-top.

Chart powered by TradingView
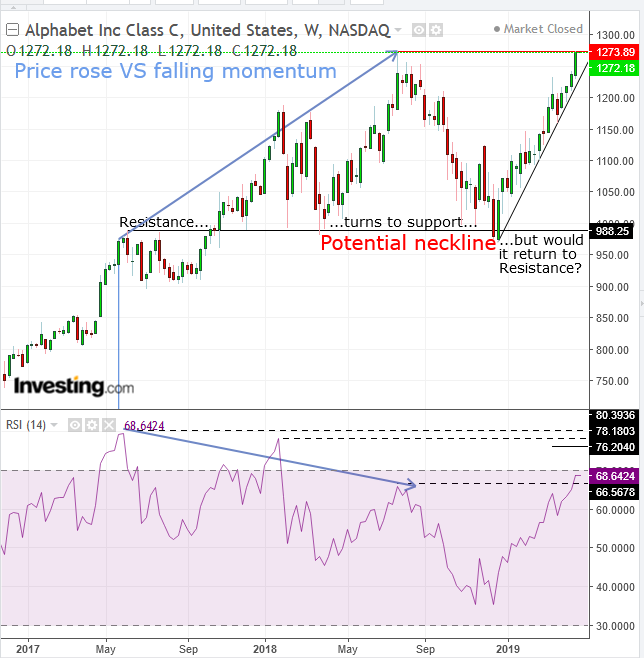
Last week’s high price was $1,273.07, stopping below $1,273.89 the all-time high posted in July. But the celebration of Friday’s record close could turn into a mournful double-top. While the weekly RSI did scale above that of July as it tracks the closing, not intraday high, price, the momentum gauge diverged twice, falling in May, to January, to July – opposing the price’s climb in that period.
A close above $1,300 would dissipate a potential double-top, but a decline below $1,200 would increase bets for a double top, whose neckline by the $990 level has demonstrated a level of considerable interest over the last two years.
Therefore, we advise caution.
Trading Strategies
Conservative traders are going to wait for a close above $1,300 or a fall below $900 for a clear trend.
Moderate traders might short on a peak-and-trough reversal within that price range or go long after the correction that follows the $1,300 break.
Aggressive traders may enter a contrarian short, provided they have a pre-written plan, which includes a loss their account could withstand in what is expected to be a volatile session.
Trading Sample
- Entry: $1,273
- Stop-Loss: $1,275
- Risk: $2
- Target: $1,263
- Reward: $10
- Risk-Reward Ratio: 1:5
