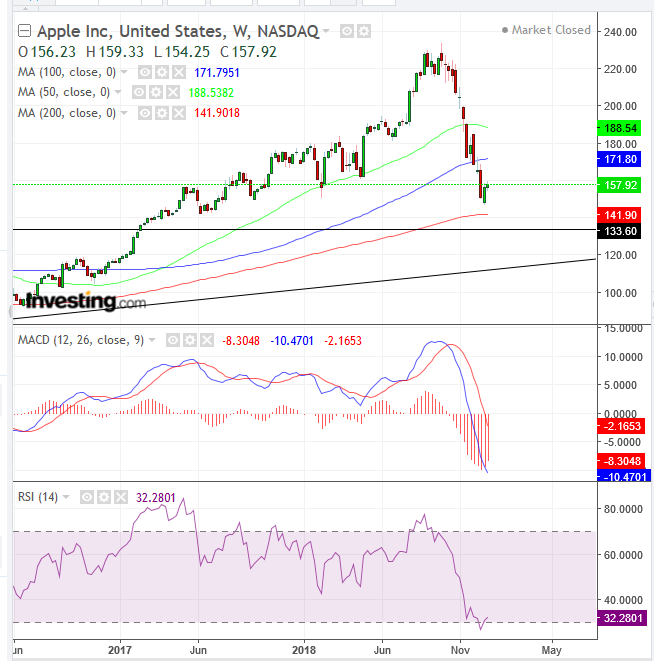
Yesterday, after US markets closed, Apple (NASDAQ:AAPL) cut its sales outlook for the first quarter, citing an unexpected slowdown in China. The iPhone maker reduced its guidance for the first time in 12 years and, for the first time in almost 20 years, softened its projections for revenue.
The stock closed yesterday at $157.92, but that was before the announcement. Shares plunged in after hours trading, falling to $145.82 at time of writing. That’s a loss of $12.10, or 7.66%.

From its October 3 record peak of $233.47 to its December 24, $146.59 low, the price dropped $85.32, or 36.54%. If you take into account current futures prices, that would be a loss of almost $88, or 38%.
The stock is clearly in a bear market. It's also obviously in a medium-term downtrend. However, after such a serious decline, it's becoming primed for a potential uptick at the end of a correction, at least for now.
If the US market does crash, as all indices sink into bear market territory, it’s safe to assume that Apple shares will follow. But at the moment, Apple may be nearing a short-term buying opportunity, after all the bad news has been broadcast and therefore priced-in.
Two weeks ago, the 50 DMA crossed below the 200 DMA, triggering a Death Cross, the most well known technical phenomenon and one that's closely followed by Wall Street. However, the RSI fell to 21, signaling the most oversold condition for the stock since February 5, and curved upward. Also, the MACD provided a buy signal.
The weekly RSI fell to 26, its most oversold level since the 2008 crash; the MACD is the most oversold on record.
All this occurred before the shocking guidance hit the news. The futures markets, however, will likely have taken some of the heat for pricing in the new trajectory, and investor reaction could shift during regular trade. Still, we can anticipate how much more the stock may move using technical analysis and so prepare for a potential buying opportunity.
A price level that may attract considerable demand is in the lower $130s. This was an area where supply drowned out demand during 2015, after investors became disillusioned with the Apple Watch, which didn't turn out to be the "next big thing” since the iPhone.
Shares fell 33 percent between mid-2015 and mid-2016. However, the news that the company sold its billionth iPhone overturned the supply-demand balance. That was the fundamental driver behind the $133 level turning it from resistance to support.
Will investors remember those price levels and tell themselves that Apple can't fall any lower, thereby seeing a buying opportunity at this level? Note too that this support level meets with the long-term uptrend line since the 2009 bottom within 12 months, at the current levels, also providing a long-term support. Finally, the 200-week MA 'guards' the support of the 2015 highs.
Where Fundaments Meet Technicals
Apple's new revenue expectation is $84 billion, down from a range of $89-93 billion. That's a reduced outlook of 9.7%. It's therefore reasonable to assume that the same decrease should be reflected in the stock's price, bringing the rebalanced share price to $142.51.
However, since in economics prices often swing from one extreme to another around the fair value, we can’t necessarily count on traders acting rationally. Other factors likely weighing on the price of the stock would be general worries about a global economic slowdown, particularly in China, compounded by back-to-back Chinese manufacturing PMI releases both showing contractions. That's more than enough to trigger a selloff.
Therefore, traders will likely look for consolidation, as a sign of bullish presence. A good place to look for demand to rise is the area between the 2015 highs—a 15% drop from yesterday’s closing price—and the 200-week MA.
Trading Strategies
Conservative traders would only trade when the medium-term downtrend realigns with the long-term uptrend.
Moderate traders may want to see proof of a short-term uptrend, with two ascending peaks and troughs.
Aggressive traders may move to act if the price of the stock manages to close above last week's $146.59 low, interpreting from the support that the reduced outlook is priced-in. Otherwise, they'd look for a sign of consolidation above the 200-week MA. If that doesn't happen, above the 2015 highs would be the next buying opportunity.
Trade Sample:
- Entry: $140
- Stop-loss: $130
- Risk: $10
- Target: $170
- Reward: $30
- Risk-Reward Ratio: 1:3
