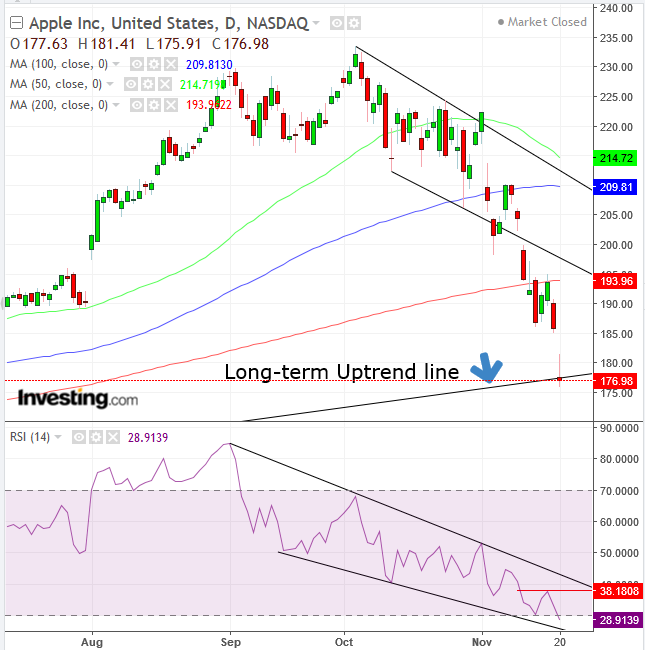
FAANG stocks are now officially in a bear market. That's based on the metric that this occurs when there's a correction of 20 percent from an asset's peak.
Apple’s (NASDAQ:AAPL) rout is the amalgamation of several triggers:
- Concerns that iPhone sales have peaked,
- Recent consumer data showing potential cracks in the longest bull market on record, making vulnerable Apple’s strategy of continuously raising prices to compensate for a slowdown in smartphone sales,
- Apple’s effort to transform itself from a hardware manufacturer to a service provider, a strategy that has yet to prove itself, and
- As the world’s biggest company, Apple has become a proxy for global trade woes.
The question is whether these reasons will continue to weigh on shares. Or, will a 24 percent discount and full correction to the long-term, uptrend line since the May 2016 bottom attract enough demand for a rebound, even if not for another record high.

While the mid-term trend is down, the long-term trend for the stock is still up, as defined by the direction of peaks and troughs. Three weeks ago, ahead of Apple’s corporate results, we forecast that even with stellar earnings Apple may top out.
Having reached our target—and then some—the stock could now provide risk-takers with an exceptionally attractive trade from a risk-reward perspective. So far, the weekly candle is forming an inverted hammer, a bullish signal upon confirmation, with the next weekly candle at least opening, but preferably closing, above the current candle’s real body.
Trading Strategies
Conservative traders may want to wait with a long position for the mid-term trend to realign with the long-term uptrend, or for the long-term uptrend to post two descending peaks and troughs for a short position.
Moderate traders may enter a long position after a second weekly candle confirms the current inverted hammer. If this week’s candle doesn’t end up as an inverted hammer, we’d recommend waiting for the price to rebound above this week’s high price.
Another indicator for a rally would be the RSI’s bottoming out, rising above its previous peak at 38. Note, that the higher price that follows the confirmation will increase exposure, by the distance from the uptrend line’s support but would reduce the risk-reward ratio. Therefore, we recommend traders at this risk-level wait on entry for a potential retesting of the support, for the closer entry.
As for aggressive traders, the price for the reduced risk is the opportunity cost, if the price will not test the support but simply advance.
Aggressive traders may enter a long position now.
Trade Sample:
- Entry: $177
- Stop-loss: $175, round psychological number below long-term uptrend line
- Risk: $2
- Target: $185, below potential resistance of the November price cluster
- Reward: $8
- Risk-Reward Ratio: 1:4
