There's escalating bad blood between Australia and China—which began after the coronavirus outbreak in Wuhan, the capital of China's Hubei provence, started its global spread—as an ongoing skirmish between the two trading partners gathers steam.
The tiff appears to have started in April when Canberra called for "all members of the World Health Organization (WHO) to support an independent review into the origins and spread of the coronavirus." After that, Beijing called for Sino nationals to consider avoiding Australian products and look for vacation destinations elsewhere in the world. The spat has continued since then.
Today's salvo, if confirmed, gives Australian officials reason for outright panic. A Reuters article, released today said:
"China, the world's top coal consumer, reportedly informed key buyers to avoid Australian coal last week, part of a broader move to limit imports that also inflamed already-fraught trade ties between Beijing and Canberra."
Since Australia supplies a significant percentage of China's coal—over 40% of the country's coking coal imports in 2019, and about 57% of thermal coal needs—it's not just the Australian mining industry and the nation's trade balance that are taking a hit. The Australian dollar/Chinese yuan pair could also be reflecting the complexity of the deteriorating diplomatic situation between the two countries.
The supply versus demand balance on the technical chart bears that out.

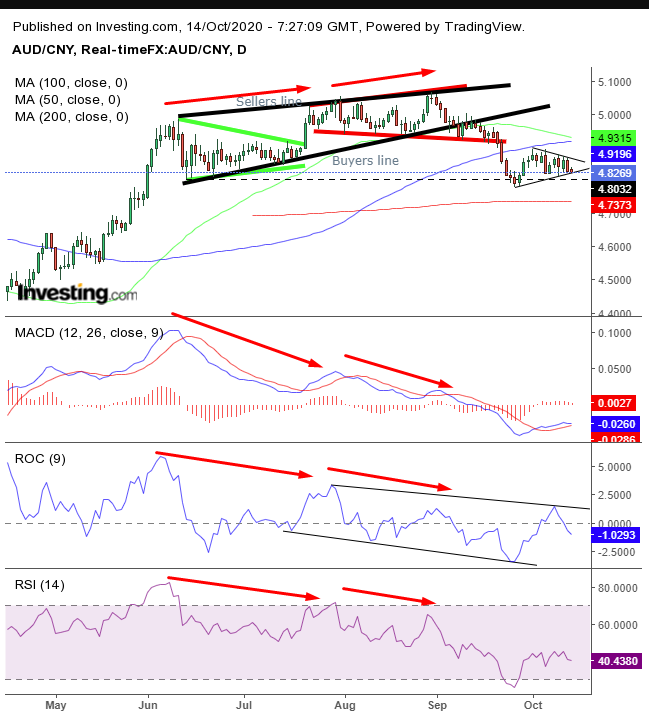
The AUD/CNY completed a broadening top (red), which upended the preceding bullish symmetrical triangle (green), projecting the shift. Observant chartists would have noticed broad and consistent negative divergence signals.
Both momentum indicators, the ROC and RSI, as well as the price-based MACD, have fallen twice, while the price itself gained twice.
These negative divergences are marked by red arrows on the respective charts. It is rare to see both momentum-based indicators lining up and rarer still to see them agreeing with the MACD.
The shift from a bullish symmetrical triangle to a bearish broadening pattern formed an even larger rising wedge, bearish after the preceding spike. A pattern in which both highs and lows rise is bearish because it indicates buyers are more eager than sellers.
This is depicted by the faster-rising buyers’ line (pattern bottom) versus the less-steep sellers’ line (pattern top). This type of activity escalates the frustration level of buyers, with the ever-shorter rallies that cut into profits—that is, until disgusted traders dump their contracts, sending prices to the downside.
The downside breakout, which completed both the broadening pattern and the rising wedge, then moved higher again—toward the overlapping patterns—as short sellers covered themselves to take profit and return borrowed contracts to brokers.
However, even during this period there has been another, albeit smaller, bearish pattern developing: a pennant whose congestion demonstrates an intense influx of trades as supply and demand forces meet after a significant move. That will continue till one side absorbs the other, leaving a vacuum that sucks trader orders into the newly found cavity beyond the pennant. As a continuation pattern, it’s expected to break to the downside.
Note how the major moving averages precisely interplay with the price patterns:
- The 50 DMA, after having provided support for the symmetrical triangle, failed to support the broadening pattern, which shifted from what could have been a rising channel into a rising wedge...and is now falling to the 100 DMA.
- The 100 DMA—through which the price plummeted—became a clear resistance to the pennant.
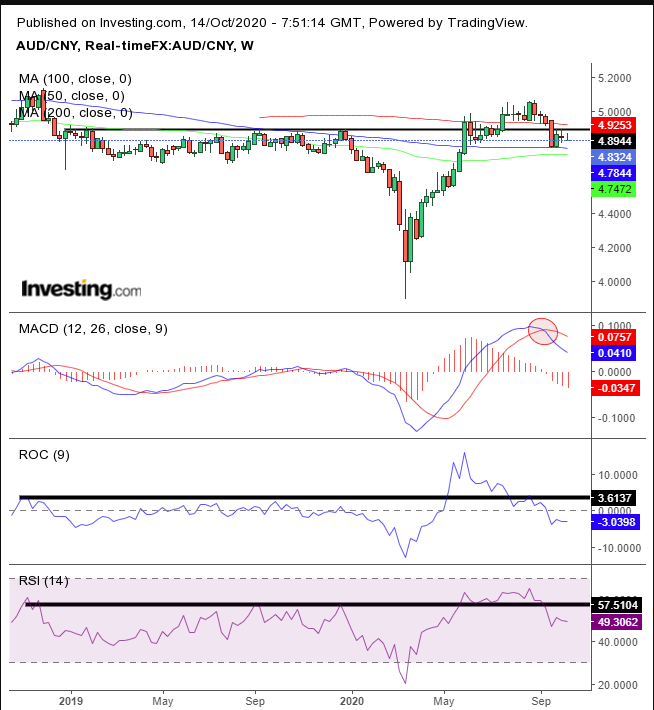
Technical analysis is a puzzle requiring analysts to figure out how everything fits. The symmetrical triangle’s low provided support for the pennant’s low. Seeing the bigger picture, via the longer-term weekly chart, helps to understand how the entire puzzle's pieces mesh:

Note that the 4.9 level has been a critical point for supply and demand, represented by the black line. Then, notice how indicators topped out even ahead of the price.
Trading Strategies – Short Position Setup
Conservative traders may want to wait for the price to fall below the 200 DMA, then find resistance upon an attempted rally.
Moderate traders may be content with a fall below the September low, then wait for a return move.
Aggressive traders may risk a short position to ride the expected downside breakout, provided they understand the risk of the price returning first toward the pennant top, even if it would retain its trading pattern. Understand too that unexpected news could shift the balance of supply and demand. That’s why a coherent trade plan is essential. Here’s an example:
Trade Sample
- Entry: 4.8400 – upon a rally
- Stop-Loss: 4.8500 – psychological round number
- Risk: 100 pips
- Target: 4.8000
- Reward: 400 pips
- Risk:Reward Ratio: 1:4
Author's Note: This is a trade sample, not analysis. That’s in the body of the article. This is just one of many approaches. You can change the parameters to suit your account, timing, risk aversion and strategy.
