'Boing' may be the healthy sound of a spring rebounding into shape, but unfortunately, as much as aeronautics giant Boeing's name might be pronounced similarly, there's likely not much rebounding in its near-term future.
Shares of Boeing (NYSE:BA) have been falling ahead of its Q1 2020 earnings report, scheduled for Wednesday, April 29 before the market opens. The company is expected to report EPS of ($2.02) on Revenue of $17.17B amid more delays to the fixes necessary to relaunch the company's most popular model, the 737 MAX, which has been grounded since March 2019 and production cuts for its 787 Dreamliner.
At worst, the slump is being driven by informed money, people connected enough to the company to get a whiff of what’s going on within. At best, investors’ could be questioning the valuation of the manufacturer as determined by news claims of shoddy production drawing scrutiny to Dreamliner.
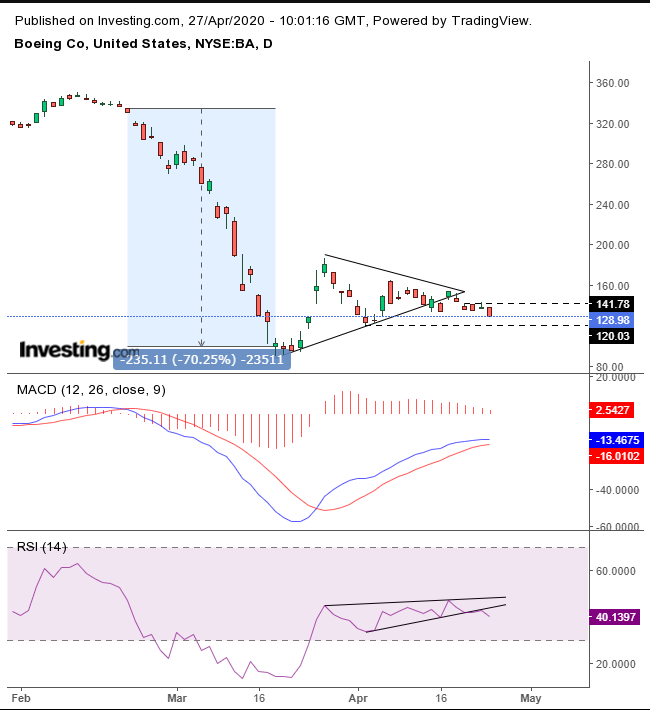
Whatever the fundamental cause, the downward shift might be easier to understand via the technical chart.

The world-wide lockdown following the breakout globally of the COVID-19 pandemic grounded airlines, no matter what planes were in their fleets, as countries closed borders and travelers were urged to shelter at home. The stock dived a mind-boggling 70% in less than a single month. On March 12 alone, Boeing shares suffered their “worst one-day drop since 1974.”
At the time, investors questioned whether the move was exaggerated. If governments would likely rescue the company and if lockdowns eventually end, perhaps the stock had become extremely undervalued. On that narrative the drop paused, as prices traded within a pennant-shaped pattern, showing that supply and demand were equally determined.
However, the downside breakout settled the question: investors still believe the stock is overvalued. The lagging MACD is turning downward, while the RSI already fell, completing its own pennant.
Moreover, while it’s difficult to remember now, Boeing’s stock tumbled well before COVID-19, pressured by the 737 MAX crisis during the previous year when the company posted its first annual loss since 1997, after repeated fatal crashes.
While signals are starting to emerge that economies may slowly begin to open, no one knows yet how long it will take for things to get back to normal. As well, it's hard to determine how long it might take for people’s shaken confidence to return to a level that's comfortable enough to facilitate flying around the world again; worst of all, no one has a clue if there might be a second wave of coronavirus as health-related strictures ease. The World Health Organization said Saturday that there is “no evidence” that recovered patients are even immune to a second occurrance.
With so much uncertainty, all we can do is follow the money and learn how to apply a strict trading plan in order to easily bounce back from a losing trade.
Trading Strategies
Conservative traders would wait for a return move to retest seller determination, with prices finding resistance by the pattern.
Moderate traders may wait for a corrective rally—for a better entry, not necessarily for retesting the supply-demand balance.
Aggressive traders may sell ahead of earnings, counting on the technical trigger, whose message is compounded ahead of earnings.
Trade Sample
Entry: $140, upon a rally to the highs since the breakout
Stop-Loss: $145, above breakout level
Risk: $5
Target: $120, April lows
Reward: $20
Risk:Reward Ratio: 1:4
Note: A trade sample is a device to convey the key components of a coherent trade plan. Not every trade can win. No trade is suitable for all traders. Feel free to change the entry points, stop-loss and target per your temperament and capita. But you must trade according to your preset plan, or your trade results — good or bad — will be meaningless.
