International Business Machines (NYSE:IBM) is scheduled to release corporate results after market close today, for the fiscal quarter ending December 2019. Analysts forecast EPS of $4.69, down from the $4.87 posted for the same quarter last year and revenue of $21.64 billion, down from the $21.73 billion a year earlier.
The venerable tech giant's track record on earnings has been checkered for many years: it's seen 17 quarters of EPS beats, while revenue missed 11 times during the same period.
IBM has a lot of explaining to do to shareholders: the stock is down 12% over the past 5 years, while other big software companies such as Microsoft (NASDAQ:MSFT) and Salesforce (NYSE:CRM) have added more than a staggering 200% of value in the same time-frame.
The company affectionately known as "Big Blue" survived into the new millennium, at a time when so many other older technology companies ended in the mass graveyard, by astutely refocusing its main business toward software creation. However, the next hurdle for the behemoth has been cloud technology — and corporate clients seem to be taking their cloud-related business to the likes of Amazon (NASDAQ:AMZN), Alphabet (NASDAQ:GOOGL) and Microsoft.
To get back in the race, IBM needs to either prove to the market that their cloud business is catching up or that it can provide a new vision.
Do investors believe IBM will make it? They haven’t made up their minds.

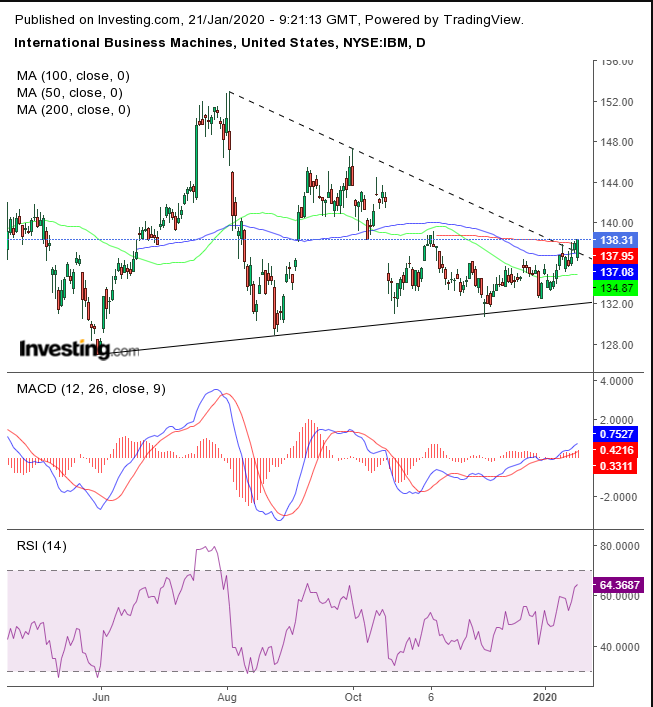
On Friday, IBM closed at the top of its session — a bullish show of force — above the 200 DMA and reaching the highest since Nov. 6. The price closed for the second day above the dotted downtrend line since the Aug. 1 high. This, together with the close above the 200 DMA, increased the probability of blowing out what could still prove to be a nasty H&S top. However, the MACD and RSI lend credence to an upside breakout, turning the H&S top on its head.

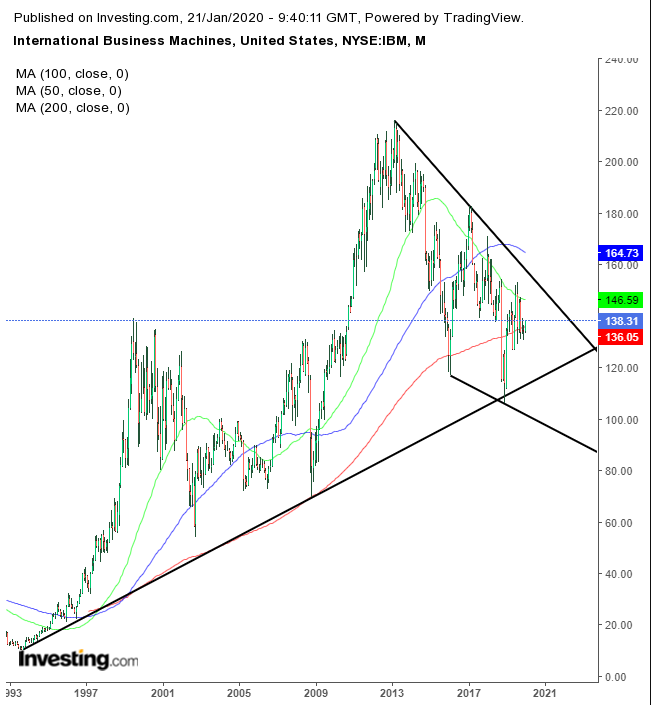
Taking the long view, it's easy to see how the stock overcame its 2000 bump in the road. Though it soared to the heights of $215 in March 2013 but has been unable to climb back since. It was sent into a downtrend and crashed into the long-term uptrend line since 1993.
That line has never been broken, bar the solitary exception of a single day: the notorious 2018 Christmas Eve, the worst in American stock history, when benchmarks were a hair's breadth away from a 20% correction, which would have been a formal bear market.
Even the 2000 and 2008 crashes failed to penetrate that otherwise impenetrable uptrend line. Given that stocks are expected to fall amid today’s global selloff, IBM’s stock is likely to slip, whatever the earnings.
However, if the results suggest that the company's cloud strategy is still not delivering the goods and it hasn’t been able to formulate a new, winning vision, we can expect the completed H&S whose downside target will retest that uptrend line since 1993, for the second time in two years.
Trading Strategies – Short Position Setup
Conservative traders should wait for a 3% penetration as a filter to avoid a bear market, then wait for a pullback that proves resistance beneath the neckline.
Moderate traders can short after the stock falls 2% below the neckline, then wait for a return-move for a better entry, not necessarily for proof of trend.
Aggressive traders would risk a short on a single percent penetration. Then they could wait for a potential pullback for an entry closer to resistance.
Trade Sample
