This article was written exclusively for Investing.com
The USD/CAD continues to trend lower amid widespread weakness for the greenback and as ongoing “risk-on” sentiment boosts commodity dollars, with the S&P 500 on the verge of breaking to a new record high. The Canadian dollar has been supported further by recovering oil prices, Canada’s key export commodity.
But after falling continuously from its March peak, can the bearish trend continue for the USD/CAD?
My gut feeling is that yes it can, for at least a bit longer. But I suppose a better question would be this: can the positive trend continue for risk assets? Right now it is all about the “risk-on,” trade, which is exactly what has been driving the USD/CAD and nearly all other markets. So long as this continues to be the case, the path of least resistance would remain to the downside for the USD/CAD.
But as far as today is concerned, there is the potential for the buck to react positively to the upcoming data releases, which include retail sales, industrial production and consumer sentiment. From Canada, we will have manufacturing sales.
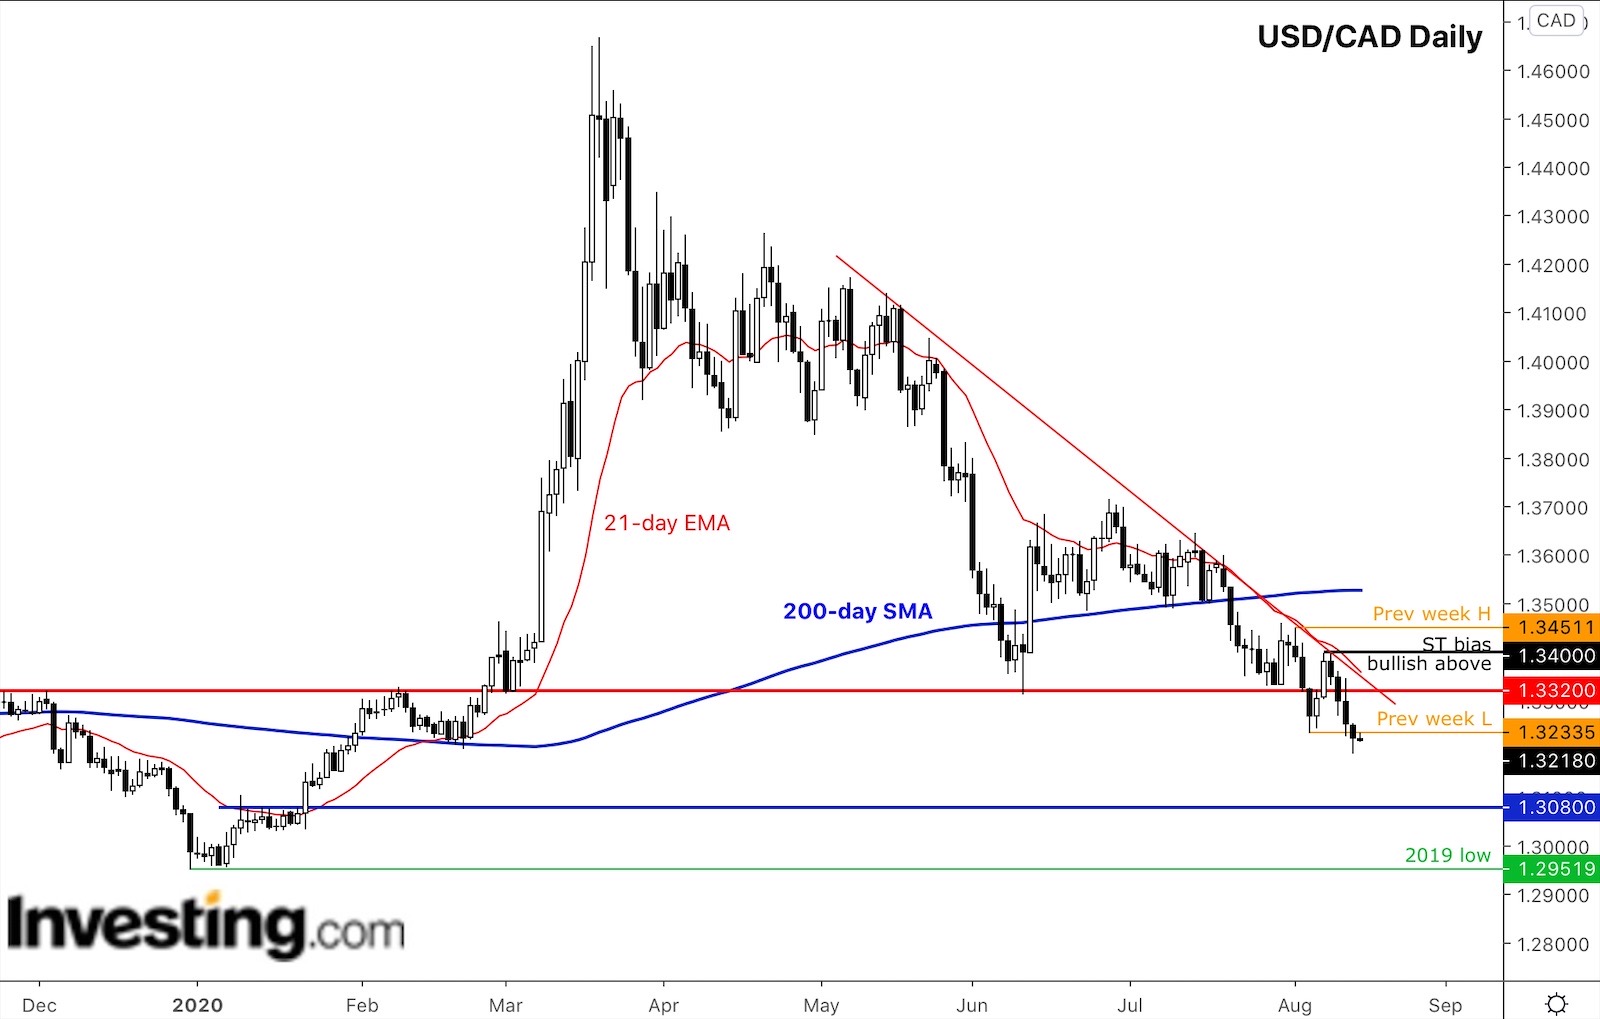
From a technical perspective, the USD/CAD is clearly in a downward trend, with rates making lower lows and lower highs. A bearish trend line has been established; the 21-day exponential moving average has been providing decent resistance. Every recovery attempt has failed thus far.

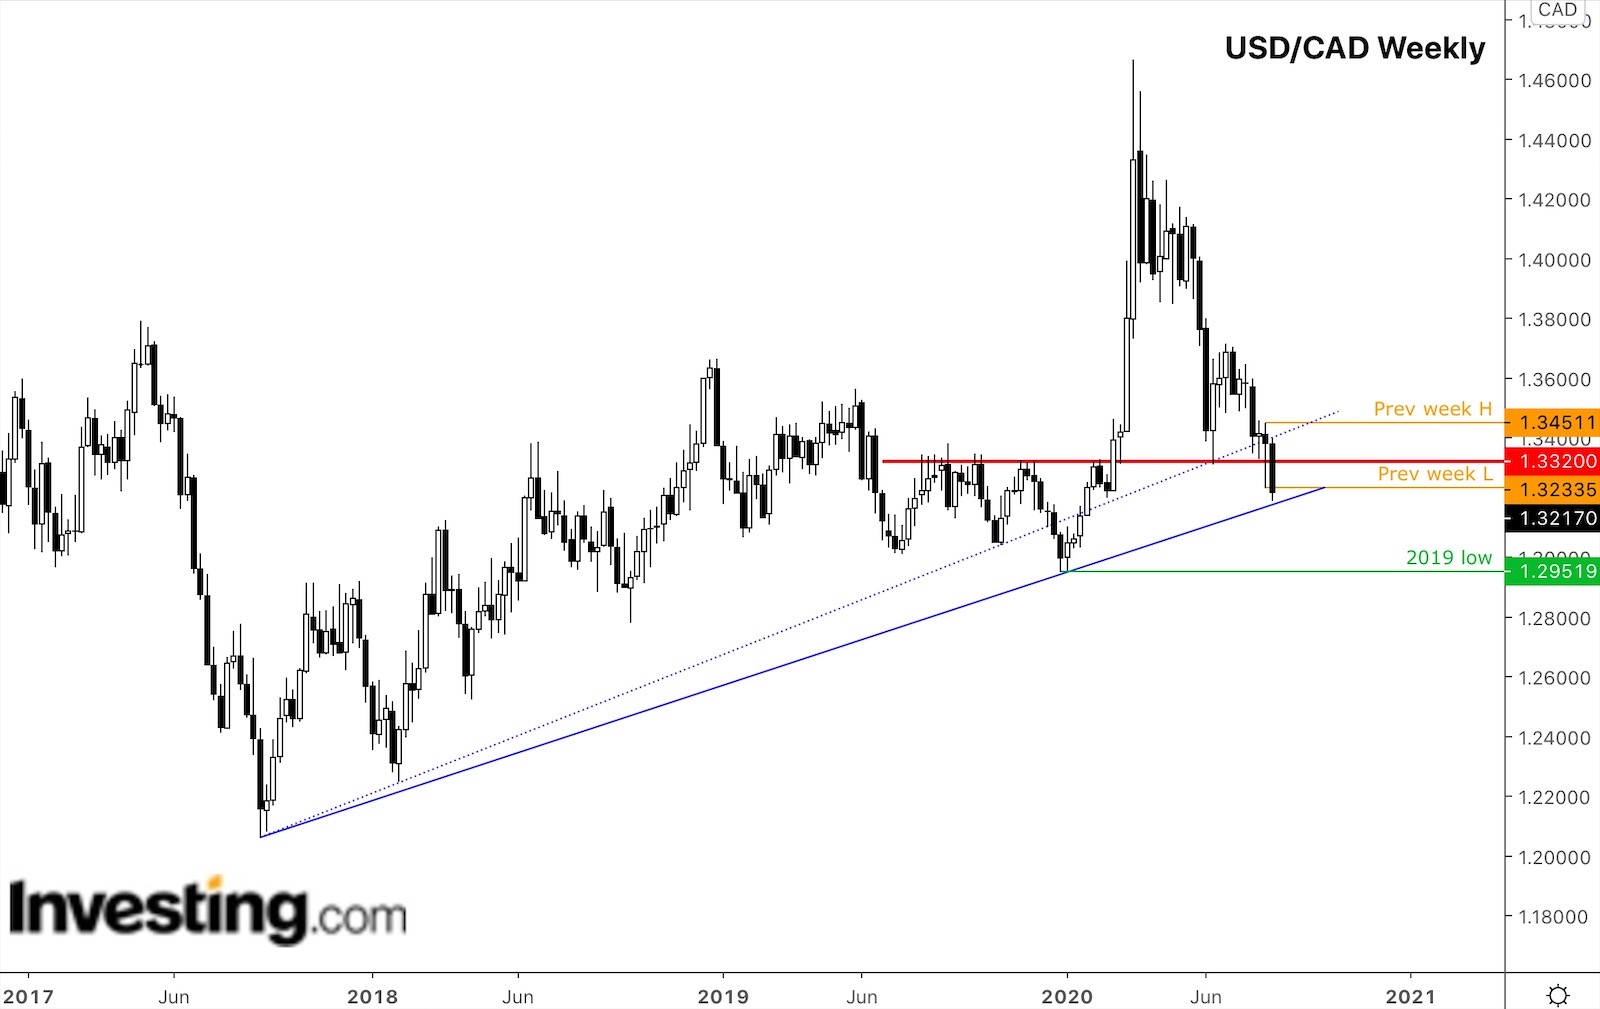
However, zoom out a little and the weekly, below, still shows a rising trend line, which has not been broken yet. Therefore, I wouldn’t rule out the prospects of a recovery from around the current levels or slightly lower, as this long-term bullish trend line is tested.

That said, lots of support levels have already broken down and the long-term bullish trend may also give way if the ongoing risk-on trend continues for the wider markets.
Indeed, one could argue that if the USD/CAD was going to push higher it should have staged a good recovery from higher levels, such as the key former resistance level at 1.3320. In fact, a couple of months ago it did try to recover from around this level, only for the bears to step in again and drive prices lower. With 1.3320 now broken, the odds of a recovery look slim.
So, given the above considerations, I think the USD/CAD may go on to break below its long term bull trend and potentially head down to daily support at 1.3080 next. If that level breaks and price holds below it, then the subsequent major objective (from a bearish point of view) would be the liquidity resting beneath the 2019 low at 1.2950/2, where it is likely that many (trapped) bulls would have placed their stop orders.
I would maintain my bearish view on the USD/CAD until and unless I see a significant bullish reversal on the daily time frame. At this point, the two potential bullish scenarios that I can think of are as follows:
- A brief, false, break below the 2019 low at 1.2950ish and a quick rejection
- A break and golf above an old high - the current most recent high being at 1.3400ish, which is now the line in the sand for me
If any of the above scenarios play, only then will I entertain the bullish idea. Otherwise the (bearish) trend remains our friend when it comes to trading the USD/CAD. My previous update on this pair can be found here.
