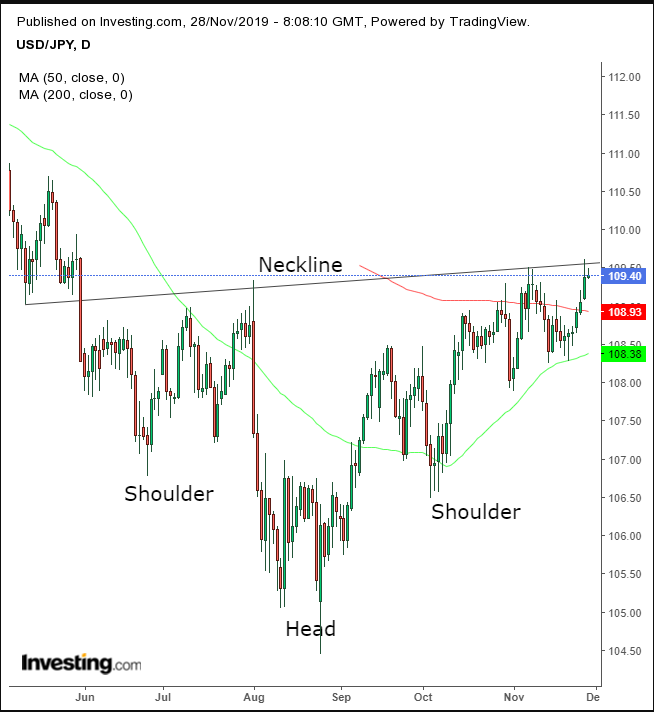
The yen is falling for the seventh straight day and the USD/JPY pair is now threatening to break out of a bearish pattern — driven by a combination of events, geopolitical and economic.
One key development was U.S. President Donald Trump's signing of the Hong Kong bill backing protesters, that is likely to infuriate China and put in jeopardy any progress toward Phase 1 of a trade agreement between the world’s two largest economies.
But despite an initial selloff after the news emerged, the dollar later rebounded and is once again gaining against the yen, surprising considering the added strain the new bill brings to the U.S.'s relationship with China. Investors might have expected the yen to strengthen at this point, due to its haven status.
But, of course, as the saying goes, it’s the economy, stupid. While the IMF slightly improved its growth outlook on the U.S. economy for next year by 0.2% to 2.1%, it cut its 2019 forecast for Japan for the third time this year, from 0.9% to 0.8%. Next year, it expects the Japanese economy to slow down to just 0.5% growth.
This appears to be taking its toll on the country’s currency. So much so that it's offsetting the yen's haven status significantly.
Meanwhile the USD/JPY pair is set to breakout of a bottom.

The USD/JPY is fluctuating against the neckline of a H&S bottom since June. The price scaled above the 200 DMA during this leg in the rally. An upside breakout would demonstrate a shift in the supply-demand balance in favor of bulls who recognized the bottom.
A climb above the psychological 110 level would include scaling above the 200W MA for the first time in 14 months. And that could bring to the table a macro trend shift that we’ve been monitoring for the past couple of years.
Trading Strategies
Conservative traders would wait for a close above 110, then for the potential pullback to reaffirm support above the broken neckline and the trend shift it represents.
Moderate traders may be content with a return move for the better entry, not necessarily for further evidence in the new, long-term uptrend.
Aggressive traders may enter a contrarian trade, counting on the U.S.-China trade spat escalation to kick in with further headlines, compounded by the overheating, seven-day rally as it comes up against the neckline of six-month H&S bottom.
Trade Sample – Contrarian Short Entry
