The dramatic volatility we've been seeing in the price of oil provides a powerful reminder that trading this commodity is also subject to the fundamental uncertainty currently plaguing the broader market. To try and make sense of the seemingly erratic path oil prices have been taking, it helps to briefly look at the geopolitical drivers, then focus on mapping out the various roads the price trend could next take and the important intersections on the way.
Negative Fundamentals
Crude retreated from a 12-week high on a surprise API weekly crude inventory buildup yesterday. The release showed an increase of 1.4 million barrels in the week ending Dec. 6 to 447 million; analysts were expecting a fall of 2.8 million barrels. Investors now await the official, U.S. Energy Information Administration report, due out today.
Shale oil output is on track to rise next year, further oversupplying the market. The EIA outlook for a surge in U.S. production suggests the country will become a net exporter for the first time on a yearly basis in 2020.
In addition, Venezuela’s oil production reportedly leaped over 20% between October and November, since America toughened sanctions against PDVSA.
Potentially Positive Fundamentals
OPEC and its allies agreed on Dec. 6 to deepen production cuts, demonstrating the cartel members can cooperate to keep the market from flooding.
The outlook for a recession has eased, particularly after last week’s U.S. jobs reports. The unemployment rate is back at a 50-year low. Hourly wages rose by 3.1%, slighter better than the 3% expected. Also, revisions increased the totals from the two previous months.
Trade Wild Card
However, it's become clear that trade issues are offsetting all other considerations, at least temporarily. Therefore, oil prices are likely to remain in a holding pattern until Dec. 15, when the new tariffs on Chinese imports to the U.S. are set to take effect.
Technicals are sending their own messages, depending on the timeframe considered.

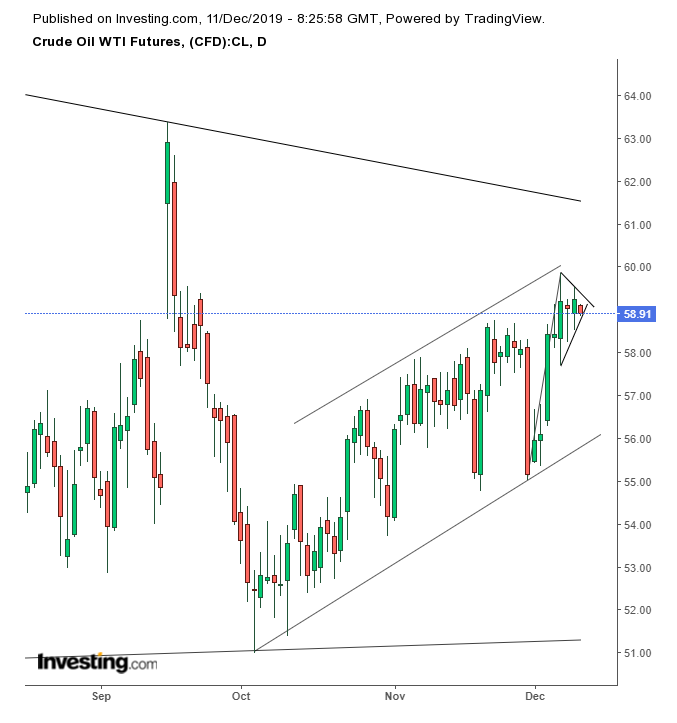
Oil's price has been ranging for three days, after advancing for five straight days, creating a bullish pennant, at the very top of a rising channel since the Oct. 3 bottom. While the pennant implies the price is set to continue higher, it must first traverse the resistance of the channel top — reinforced by the psychological $60 level.

All charts powered by TradingView
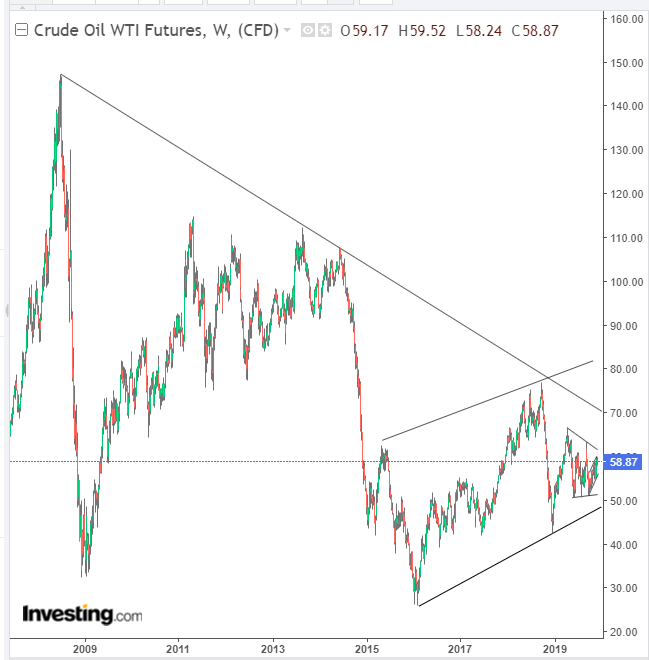
However, that’s not all. A longer look reveals the top of a falling trend line since the April highs above $66. Crude is expected to bump heads with that resistance line at $61.
If it does break above that level, it still won’t be free and clear. It will have to contend with the long-term downtrend line since the July 2008 top at $147.

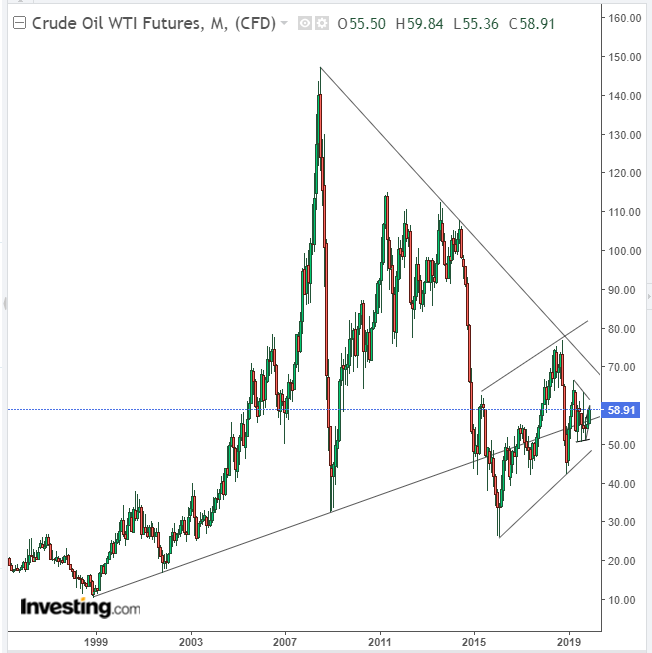
And there's more. The monthly chart clearly shows that the long-term uptrend line, since the October 1998 bottom of $10.82, runs right through crude’s current myriad conflicting patterns: the rising channel since the Oct. 3 bottom, the larger triangle since the April high and — finally — the rising channel since the 2016 bottom.
This one, long-term uptrend line suddenly clarifies the nexus of supply and demand around this area, from a technical standpoint — irrespective of the fundamentals, geopolitics and market narratives.
The fact that the price is ranging right on top of this uptrend line, from the previous millennium, demonstrates how anything goes. The price could jump back toward the $150 mark, which it approached in 2008, or fall back to the 1999 lows, nearing $10.
For now, all we can do is pay attention to the sign-posts and proceed with caution.
Which stock should you buy in your very next trade?
With valuations skyrocketing in 2024, many investors are uneasy putting more money into stocks. Unsure where to invest next? Get access to our proven portfolios and discover high-potential opportunities.
In 2024 alone, ProPicks AI identified 2 stocks that surged over 150%, 4 additional stocks that leaped over 30%, and 3 more that climbed over 25%. That's an impressive track record.
With portfolios tailored for Dow stocks, S&P stocks, Tech stocks, and Mid Cap stocks, you can explore various wealth-building strategies.
