May's retail sales, which were released yesterday, were forecast to come in negative but the release was even more disappointing than expected. After April’s +0.9% beat, consensus anticipated a pull-back to -0.8%, but the print was worse than that—consumers cut their spending last month by 1.3%.
That figure provides an example of the US economy's complexity. Just because its expanding overall, doesn’t mean every component is rising all the time nor is the growth trajectory moving upward in a straight line.
The Commerce Department's breakdown of where spending occurred last month revealed that pandemic-era winners such as Costco Wholesale (NASDAQ:COST)—where locked-down consumers purchased pantry items, household staples and cleaning products in bulk—were no longer COVID-era darlings.
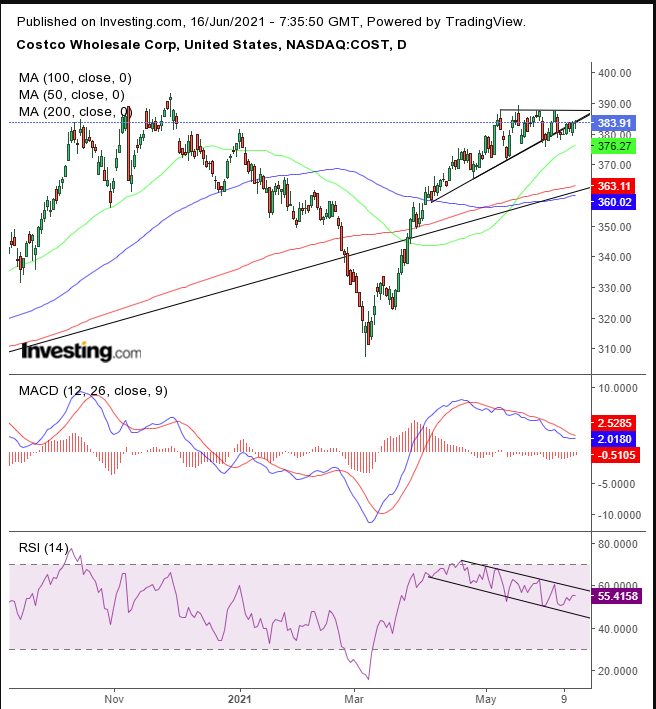
In May, with a return to normalcy in the offening, shoppers started rerouting spending toward leisure and entertainment venues among other things, in particular restaurants, bars and services. Technical analysis of Costco's share trajectory signals the toll the shift in consumer interest is taking on the stock.

After the stock fell below its uptrend line since the mid-December 2018 low, it bounced back above it. However, it's thus far failed to post a peak higher than the Nov. 30 record, which would extend the uptrend line.
Rather, it's been congesting tightly, forming a pattern that resembles an ascending triangle which is inherently a bullish triangle. An upside breakout would demonstrate that demand came out on top, and that just may be the impetus required to take on the bearish stronghold at the all-time high.
However, the price is slipping below the pattern, which may mean what's forming is instead a sharply upsloping H&S top. That also makes sense given it's developing below the previous high within the uptrend.
Whatever the pattern actually turns out to be, the direction of the breakout will likely determine the next move. A drop below the Mar. 5, $307 trough would complete a downtrend.
The moving averages confirm the chart’s pressure points. The 50 DMA points at the smoothed out short-term term, while both the 100 and 200 DMAs hug the long-term uptrend line.
Both MACDS and RSI are bearish, each providing negative divergences to the rising price from early April.
Trading Strategies
Conservative traders should wait for the price to either make a new record high before going long or fall below the Mar. 5 low in order to short.
Moderate traders would risk a position after the pattern’s breakout, which would include a minimum 2-day, 2% filter, to reduce the chances of a fakeout and preferably wait for a return-move, for lower exposure, if not for further confirmation.
Aggressive traders could wait for a 1% breakout on a closing basis; experienced aggressive traders might jump in now to beat the crowd, as long as they know to do so only with a trading plan.
Here’s an example:
Trade Sample
- Entry: $385
- Stop-Loss: $390
- Risk: $5
- Target: $360
- Reward: $25
- Risk:Reward Ratio: 1:5
