Big box retailer Target Corporation (NYSE:TGT) handily beat expectations for its Q4 earnings when it released results on Tuesday. The company saw record breaking sales growth of 21% on more than $15 billion in sales, larger than its total sales growth over the past 11 years combined. Part of its growth was due to a greater online presence.
Nevertheless, shares of Target, which increased by 81% over the past 12 months, plunged 6.75% yesterday, after the Minneapolis-based company disclosed it will invest $4 billion a year, for several years, to increase its online focus.
It's ironic that despite online sales being a key component of the retailer's stupendous earnings beat investor simply weren't 'buying' it.
The sharp selloff was likely fueled by traders looking for short- to medium-term profits rather than long-term investors looking for buy-and-hold value. Still, for now the stock’s bias is lower.

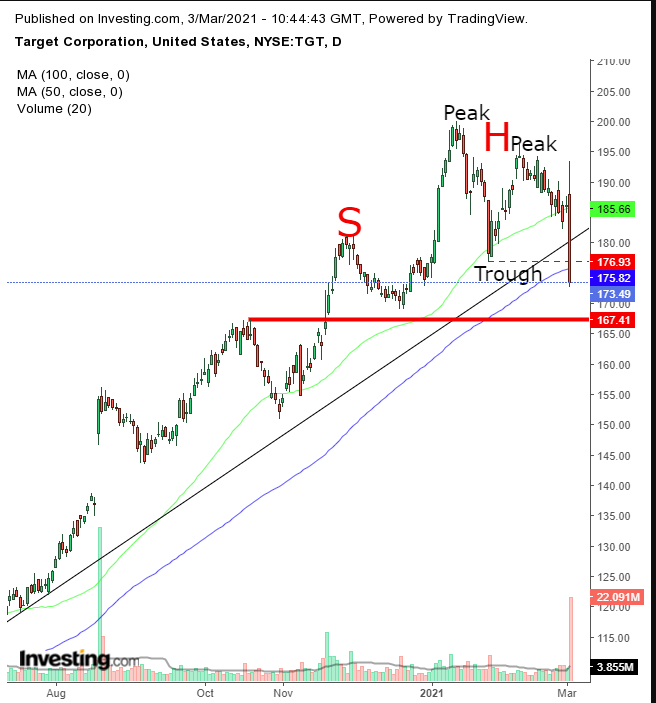
The stock slipped below its uptrend line since the April bottom, for the first time. In other words, this is the original trendline—it was not readjusted.
That potentially makes this violation a more significant head-turner. At the same time, the shares registered a lower price lower than the previous trough of $176.93, made on Jan. 27. Coupled with the Feb. 9 peak, which was lower than the Jan. 13 record high, the stock established a downtrend, with a descending series of peaks and troughs.
We might also be witnessing the development of a large H&S top, whose neckline may support a bounce, providing the return move after the breakdown.
Of significance: the volume that accompanied the downside breakout was the highest since Aug. 19, after its QE 2020 earnings blew past estimates, showing quarterly profit growth of 80%.
Even then Target's e-commerce services were showing dramatic growth, but without the unwelcome news of additional expenditures provided by the current guidance. The highest volume previously was on the decline of the first peak—a potential H&S head. Before that the highest volume was at the peak of the head, following the kind of trading activity one would expect amid a transition from an up to a down trend.
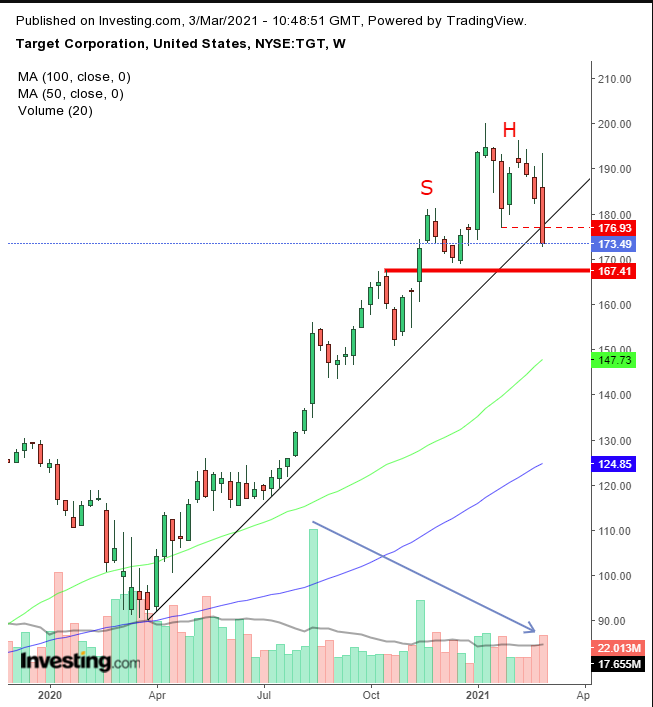
Falling participation is even more obvious on the weekly chart.

The volume has been trending lower, providing a negative divergence to uptrend of the price. While not a crystal ball predicting a decline, when added to the weight of the additional evidence, it makes a compelling case for more downward action, especially if the price were to fall below the $165 level, souring sentiment.
Trading Strategies
Conservative traders should wait for the price to fall below $165, which is likely to convert more bulls into bears.
Moderate traders would wait for the price to rebound from the $165 - $170 range, to successfully retest the fledgling downtrend with a rally that would find resistance.
Aggressive traders could short at will, provided they understand and accept the risk of fewer confirmations amid a tumultuous market besieged by shifting, even contradictory, interpretations over the same themes.
Therefore, a trading plan is a must. We don’t know what the future holds and are merely operating based on statistical patterns; therefore we urge you to only trade according to a trading plan that fits your needs.
Here’s an example:
Trade Sample
- Entry: $182
- Stop-Loss: $185
- Risk: $3
- Target: $170
- Reward: $12
- Risk:Reward Ratio: 1:4
Author's Note: This is just a sample. There are many ways to approach the same trade, based on your timing, budget and temperament. We’ve allowed for a rebound based on current market sentiment. While that avoids a whipsaw, you might also lose the opportunity if the price doesn’t go as high as our entry level. Till you learn how to customize plans to fit your needs, take small risks to gain experience. The focus should be there are no “sure things.” Consider your risk tolerance and only enter trades that reward your risk with the appropriate premium.
