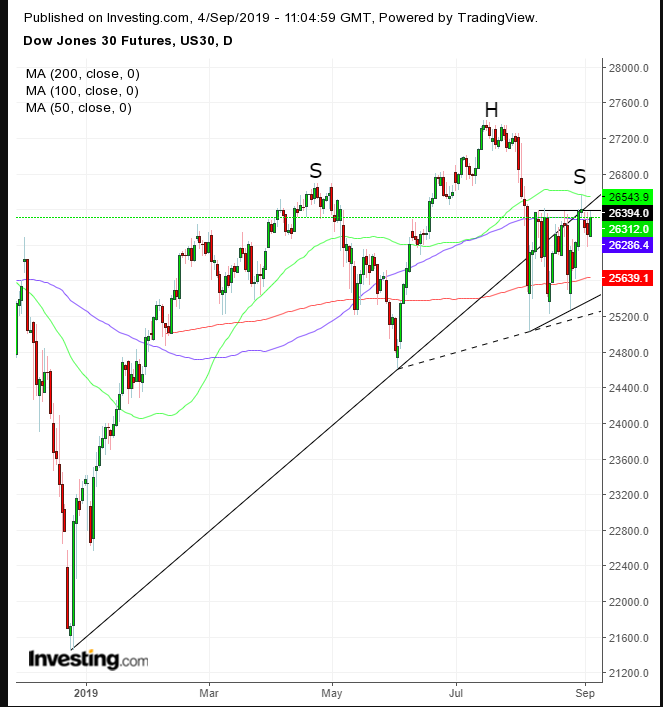
This morning, Dow futures began rising, on the perceived easing of global tensions. With the U.S.-China tariff war seemingly at a standoff, the mother-of-all geopolitical risks continues to loom large. For savvy traders, this could be a key opportunity for a short set-up.
Global risk appetite has been accelerating, thanks to the easing of multiple geopolitical situations, including China’s backing off its Hong Kong extradition bill; Italy’s growing political stability and UK politicians seeming to back away from a no-deal Brexit.
However, markets could simply be prematurely bullish, according to conclusions reached by ratings agency Moody's. In their view, the most likely scenario for the U.S.-Sino trade war, one of the two biggest headwinds to stocks in over a year (U.S. interest rates being the other), is that it will escalate further.
While the roiling tariff tiff has consistently flummoxed exasperated traders trying to establish which way equities will head next, there have been signs that overall, the market doesn’t expect a speedy resolution to the trade situation. Technical charts are clearly projecting that right now.

Despite today’s surge, the YM found resistance below the 26,400 level, the top of a congestion since early August. The range is considered an interruption within a short-term downtrend, during which short sellers take profit after an 8% drop in just five days, which occurred between July 31 and Aug. 5.
The upward bias, albeit with a flat top, may suggest that vociferous buying is gradually being absorbed by resolute supply. A downside breakout would demonstrate that supply has drowned out all demand at these levels and is willing to lower offers to find new, willing buyers. That's a sign of desperation.
The fact that the presumed continuation pattern is developing as the price attempts to climb back above its uptrend line since the December bottom is a projection of the conflict between bulls and bears amid the macro outlook for stocks with the trade conflict in the background.
The failure to climb back above the uptrend demonstrates weakness. A downside breakout would signal another leg down and the potential for a medium-term reversal.
This is clearly seen when considering that the range is potentially developing another, larger patter, a H&S top, whose left shoulder developed in April. A completion of the continuation pattern would also bring the price below the 200 DMA.
Trading Strategies
Conservative traders should wait for the H&S completion.
Moderate traders would wait for the continuation pattern completion.
Aggressive traders might risk a short position now, relying on the resistance of the continuation pattern-top
Trade Sample – Short Position
