Yesterday, we focused on the dollar. Today, we’ll focus on the euro, ahead of today's Nonfarm Payrolls report, which is being released a day early, because of the US Independence Day holiday.
The single currency is on track to extend its strongest rally in over two years. A myriad of metrics reflect the growing confidence among investors in the region's response to coronavirus.
In addition to the euro enjoying its largest two-month rally against the greenback, the options market is showing traders are optimistic and suggests the currency’s advance, far from being over, is likely to extend for the next three months. Further boosting the outlook for a sustained increase in the value of the single currency is the drop in bearishness towards the euro relative to the yen, which is at its lowest since since January.
This is an indication that investors have more faith in the ability of euro area governments to protect their citizens from a second wave, or an ongoing first wave, of the virus. This view creates an outlook for global investments being siphoned into Europe, at the expense of other economies, including the US.
Traders are also betting that the Federal Reserve will conduct yield-curve control, amassing positions in 5- and 10-year bond futures. The yield on the five-year note plunged to a record low before the minutes of the Fed's June meeting.
Yield curve control is a tool to stimulate the economy, if pushing down short-term rates to zero isn’t enough. The Fed targets longer-term rates and buys enough long-term bonds to ensure yields along the curve remain low, which keeps interest rates from rising above its target level.
It isn't just the options market that is showing the bullishness for the euro. The spot market is sending its own set of signals that the euro is about to find renewed favor among currency investors.

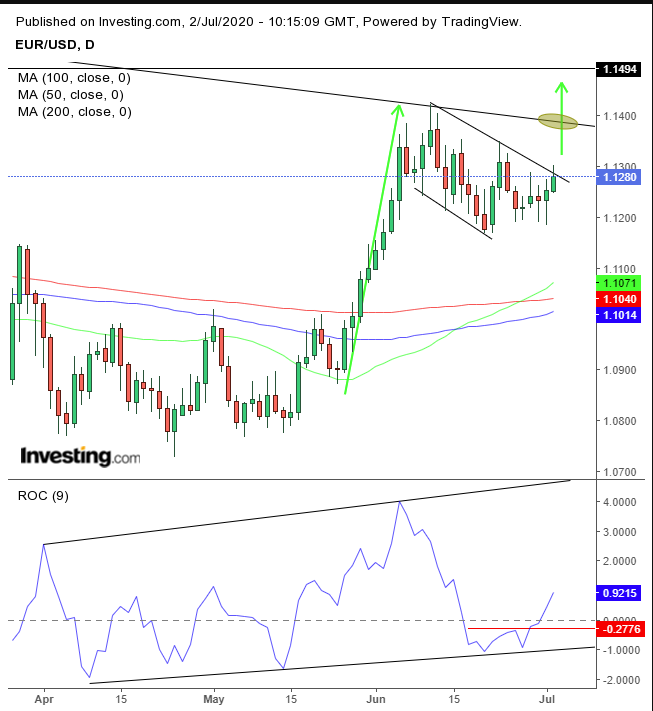
The euro is banging against the top of a ripening falling flag that has been three weeks in the making. Although, the drop shown on the chart may seem bearish, it is an essential component that reveals a hidden dynamic that renders it especially bullish.
Normally, prices fall because more traders become sellers. Within the flag, even the sellers are buyers. They are simply taking profit after the preceding surge, adding 5% in just two weeks, most of which included an 8-day long rally, its longest streak of gains since December 2013.
The force of the move caught even the bulls by surprise, who moved to lock in extraordinary profits. Unwinding these positions increased supply, which in turn put the price under pressure. The fact that the price stabilized, rather than simply dropping, shows that there were new bulls that were prepared to absorb the sudden increase in supply. This period of intense trading between buyers locking in profits and exiting and new buyers coming in results in an upside breakout, once all the supply within the flag dries up.
The breakout signals to the early bulls that the currency is starting another leg up. After they secured their winnings, they have no fear of risking another position. Their renewed demand, compounded with the entry of the new bulls, is the catalyst for another powerful move. That jump also tends to slow when profit-taking materializes within the uptrend.
When whoever wanted out cashed in, which pushed prices down, they provide another chance for those who missed the boat earlier in the move up, or to those that want to double-up on their position. The drop in supply then compounds with renewed demand and sends the price even higher.
The 50 DMA has broken above the 200 DMA, triggering one of the most repeated technical phenomena on the charts, inside the flag. This supports the argument that the falling nature of the flag is not bearish.
The Rate of Change bounced off the support at the lower end of its rising channel, bottoming out and showing that, as far as momentum is concerned, the only way for the price to go is up.
Note the overall map of the chart. The flag developed at the March highs, ahead of the psychological, round 1.5000 price level—and most importantly, after finding resistance at the downtrend line that has been in place since the February 2018 high of 1.25.
This trifecta of resistances makes it clear why investors had to take a deep breath before attacking this stronghold.
Trading Strategies
Conservative traders should wait for an upside breakout beyond this group of resistance areas, above 1.1500, and prove the uptrend is sustainable with a return move that finds support above the flag.
Moderate traders will likely be content with a move past the 1.1400 mark and patient traders would wait for a pullback for a better point of entry, if for not for confirmation of the integrity of the pattern.
Aggressive traders may jump in upon a breakout, provided they accept the risk of a wide stop-loss, or a positional loss if the price whipsaws, which is almost guaranteed, considering the fundamentals, geopolitics and technicals at play.
Trade Sample – Aggressive Long Position
- Entry: 1.1300
- Stop-Loss: 1.1150—below bottom of flag—in case of a dollar-favorable NFP read
- Risk: 150 pips
- Target: 1.1750
- Reward: 450 pips
- Risk-Reward Ratio: 1:3
