Canada's dollar is considered a petrocurrency. That's because oil is one of the North American nation's top five most valuable exports, so it makes sense that its capital would be affected by both the price of, and demand for the commodity.
There's an assumption, therefore, that when oil rises so does the CAD.
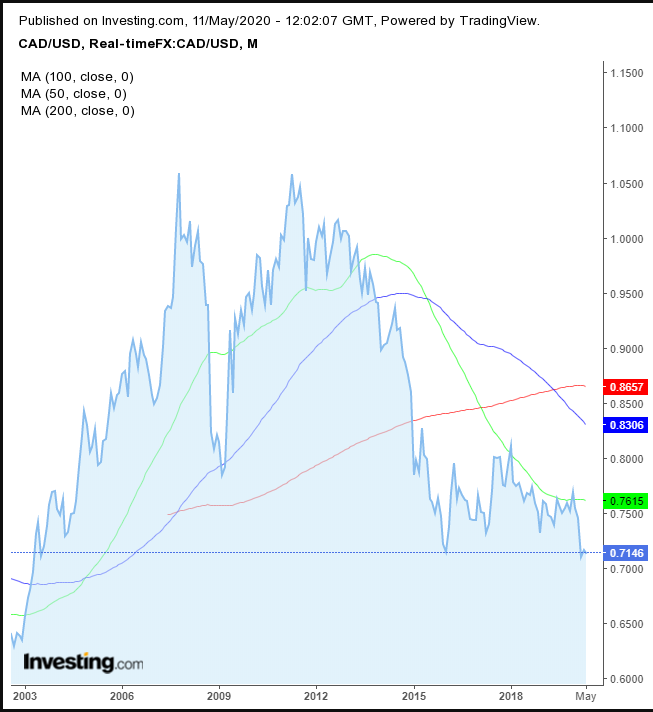
However, a look at the longer term chart reveals that the monthly prices for the Canadian dollar are currently hovering near the lowest levels since 2004. If oil prices are rebounding, shouldn't the Loonie be bouncing higher as well?
Note: to make this clearer visually, in the following chart we switched the order of the currency pair, changing it from the way retail traders are used to seeing it:

Prices paused at the March 2016 lows. A downside move would increase the odds of a continued downtrend to the 0.6 area, the 2001-2003 lows.
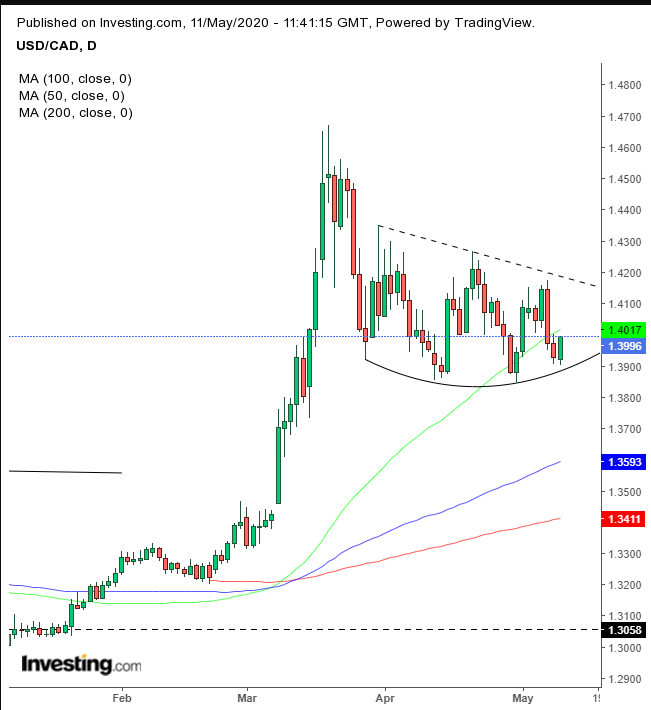
Since the Loonie is a petrocurrency, the reduced costs of US shale production along technological advancements offset the impact of oil on the CAD as can be seen in the daily chart, below.
However, at the end of April, oil rebounded from the depths of the sub-zero -$40 level, jumping close to +$10 the very next day. Yet, the USD/CAD didn't drop in unison, but rather increased its advance.
That's because the US dollar has been the currency of settlement for the oil market since the Bretton Woods Agreement Of July 1944. Additionally, when the mood of the market is risk-on, foreign investors purchase US stocks, which also require USD payments and when risk-off prevails, foreign investors want Treasurys—which also require buying the US dollar first.

As for the balance of supply and demand, its result, the price, has been rising since April, forming a rounding bottom. The USD/CAD price jumped today, after reaching the bottom of the pattern. An upside breakout of the dotted line would suggest that demand absorbed all available supply of the USD vs the CAD (or, put another way, supply of the CAD has drowned out demand). Now, buyers will be forced to up their bids to find new willing sellers, north of the pattern.
Trading Strategies
Conservative traders would wait for the upside breakout, whose penetration would preferably rise above the highest point of the pattern, then wait for a return move to solidify its completion with a new base of demand.
Moderate traders are likely to follow the same path, including the pullback, for a better entry, not necessarily to prove its veracity.
Aggressive traders may risk a long position now, considering the attractiveness of the potential risk-reward ratio with the pair’s position above the pattern bottom.
Trade Sample
- Entry: 1.4000
- Stop-Loss: 1.3900
- Risk: 100 pips
- Target: 1.4300
- Reward: 300 pips
- Risk:Reward Ratio: 1:3
