Jim Cramer, the host of CNBC's Mad Money, thinks “Facebook stock is ready to bottom; maybe it already has." His reasons? Retailers are all talking about boosting online advertising, he says, and "if you want to hit influencers...you've got to do it on Facebook."
There's lots of truth to Cramer's point about the social media giant being an optimal platform for reaching influencers since Facebook (NASDAQ:FB) owns both Instagram and WhatsApp. However, he also suggested that Facebook's recent $9 billion worth of share buybacks have yet to be priced into the cost of the stock, which closed yesterday at $144.50. According to his call, "you can buy the stock next time the market takes a header."
We strongly but respectfully disagree with his assessment on the current viability of a long position on Facebook shares.This is especially apparent from the stock's technical chart.

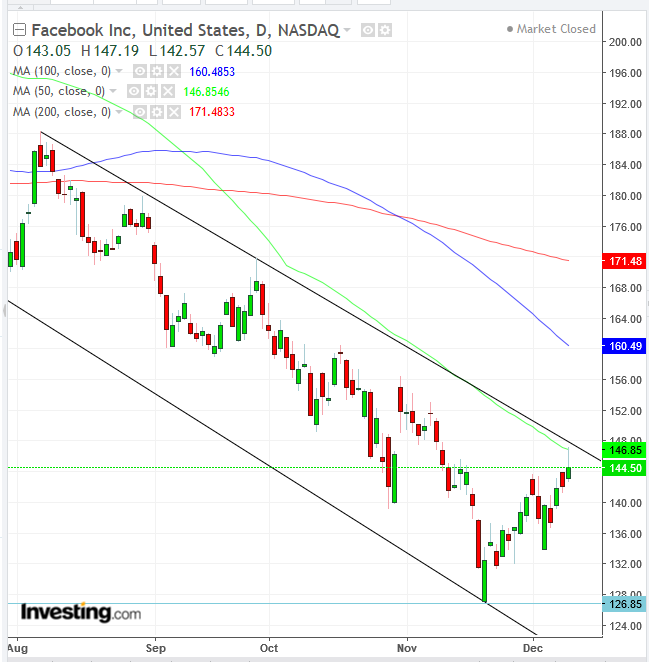
After falling 38.65% from the July 25 peak to its November 20 trough, the stock is deep in bear market territory. As such, rallies should be considered suspect till proven otherwise, via a credible reversal.
Moreover, while Cramer believes markets haven't been paying much attention to the buybacks, we think it was a deliberate judgment call. Savvy investors are actively staying away, after Facebook's string of privacy abuses brought about regulatory scrutiny, making it illegal for companies to monetize user data without permissions. At the same time disruptive and misleading posting has forced Facebook to spend considerable sums policing their platforms.
As of yesterday, bears once again came out of hiding, when bulls neared the downtrend line—also the top of a falling channel—which bears have been maintaining since August 7, the first attempt at a rally after the social media's stock plunged a nerve-wracking, unprecedented 20% after its earnings report disappointed. The 50 DMA runs along the channel-top, demonstrating its technical significance.
The pushback bulls suffered formed a shooting star, demonstrating bears had the last word. It also reinforces the resistance and the current price level as the battlefield between bulls and bears.
However, since the trend is falling, and yesterday’s trading underlined a bearish presence, we're betting prices are far more likely to retest the December 6 low of $133.67, and if that breaks, the November 20, $126.85 trough. That's a far more likely scenario as signaled by technicals, rather than a trend reversal in which price breaks the $150 mark.
Plus, if we’re proven right, a further decline may complete a massive Broadening pattern, spanning 17 months, triggering a fire sale. Should this happen it may repeat the near $90 nosedive that occurred in less than four months, between July and November. At that point, we’d be calling for a bottom and recommending a long-term investment.
Trading Strategies
Conservative traders should wait for a short-term reversal before placing a short position, when the price closes below the (dotted) uptrend line and fails, followed by a failed rally.
Trade Sample:
- Entry: $140, after falling below the dotted uptrend line
- Stop-loss: $143, projected channel-top
- Risk: $3
- Target: $134, above Dec. 6 low
- Reward: $6
- Risk-Reward Ratio: 1:3
Moderate traders would wait on a short for the price to fall below yesterday’s opening price, confirming that supply outpaces demand, then wait for the price to retest the channel top, for reduced exposure.
Aggressive traders may short now, or wait for a higher price to both reduce exposure and maximize the move. Entry: $145.20
Trade Sample:
- Entry: $145.20, after a decline below yesterday’s opening price
- Stop-loss: $147.20, above yesterday’s low
- Risk: $2
- Target: $135.20, above round psychological number, above the December 6 low
- Reward: $10
- Risk-Reward Ratio: 1:5
