Yesterday, we posted a bullish call}} on Twitter shares, despite the selloff sparked by the social media company permanently banning US President Donald Trump from their platform. Today we'll take a look at Facebook (NASDAQ:FB) which also suspended the President's account last week, after his inflammatory remarks at a rally on Wednesday sparked a chaotic riot inside the US Capitol building that led to the deaths of five people.
However, we're bearish on Facebook. In this post {{art-200548794||we're reiterating our expectation that shares of the social media behemoth will continue to flounder, something that's been going on since Dec. 23, a full two weeks before angry Trump supporters stormed the Capitol.
At that time, Facebook's already flagging reputation took another hit when the US government officially charged the Menlo Park, California-based tech giant with antitrust violations, adding yet another transgression to a list of grievances previously lobbed at the company which include user manipulation and privacy abuse.
But it's the technical, supply-demand forces that really make the case for more losses ahead.

Remember that the most recent declines occured along this timeline: Jan. 6, the Capitol was breached; Jan. 7, Facebook suspended Trump’s account indefinitely; Jan. 8, FB shares fell.
We lay out this timeline to demonstrate that the stock was already on a downward trajectory before last week's events. The ban and resulting outcry from the President's supporters only hastened what was already about to collapse.
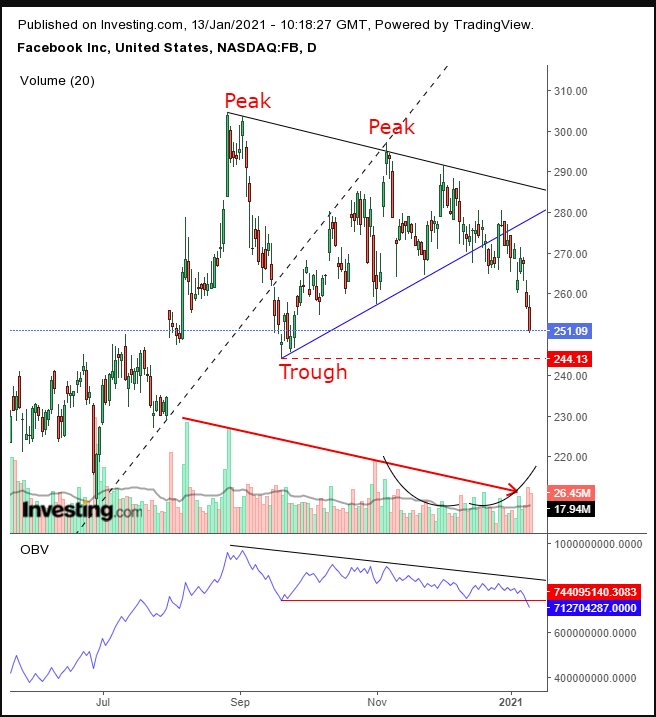
Here is our evidence: the stock fell dropped the bottom of a symmetrical triangle in mid-December, whose technical significance is underlined by the seamless appearance of the 100 DMA. It's so close you can’t even tell them apart until the triangle completes.
Then, the price attempted to climb back into the pattern on Dec. 28, only to be unceremoniously rejected from doing so on Dec. 30. At that point the price started falling, going as low as $260 on Jan. 6, 3% below the $268 price reached on Dec. 23 when we posted our original bearish call.
Perhaps the bad rap Facebook was already getting before the Trump ban is what’s causing its technicals to now deviate from Twitter, whose selloff we consider nothing more than a buying dip. Facebook, however is being pressured, even though it's already lower.
Volume on the stock has been slumping, contrary to the rising price between Sept. 21 and Nov. 5 and a symmetrical pattern since Aug. 25. Note that the volume has been moving in mirror image to the price since Nov. 23, falling as the price rises and rising as the price falls—signaling the direction in which the money will be heading.
The On-Balance-Volume indicator predicts the direction of the price. It already fell below its Sept. 21 low, suggesting the price is heading in that direction too. The indicator registered a second, lower trough, establishing a medium-term downtrend.
Trading Strategies
Conservative traders should wait for the price to register a second, lower trough, then rally in correction and confirm the downtrend with resistance.
Moderate traders would wait for the new low, then for the same corrective rise, for a better entry, not necessarily for confirmation.
Aggressive traders could short at will, provided they follow a trading plan that can withstand the whipsaws we expect.
Here’s an example:
Trade Sample - Short Position Setup
- Entry: $265
- Stop-Loss: $280
- Risk: $15
- Target: $220
- Reward: $45
- Risk:Reward Ratio: 1:3
