This article was written exclusively for Investing.com
Could we possibly also see a new record high in the not-too-distant future?
Since peaking in early August, gold has been stuck inside an ugly consolidation range as investors took profit following solid gains in the preceding months and wondered whether more stimulus was on the way to support prices further.
Well, this week alone both the Reserve Bank of Australia and Bank of England expanded their respective QE programs in an effort to offset the negative impact of the pandemic, while the Fed also said the virus outbreak poses great risk to the economy and accordingly pledged to keep its policy stance extraordinary loose.
But it was the election in the US which caused the biggest moves, as risk assets surged higher across the board. Investors speculated that more fiscal spending will be on the way, while a likely Republican-controlled senate will make it unlikely that Trump’s corporate tax cuts will be rolled back. As US 10-year bond yields fell back, gold broke out on Thursday after a very volatile session on the night of the US election.
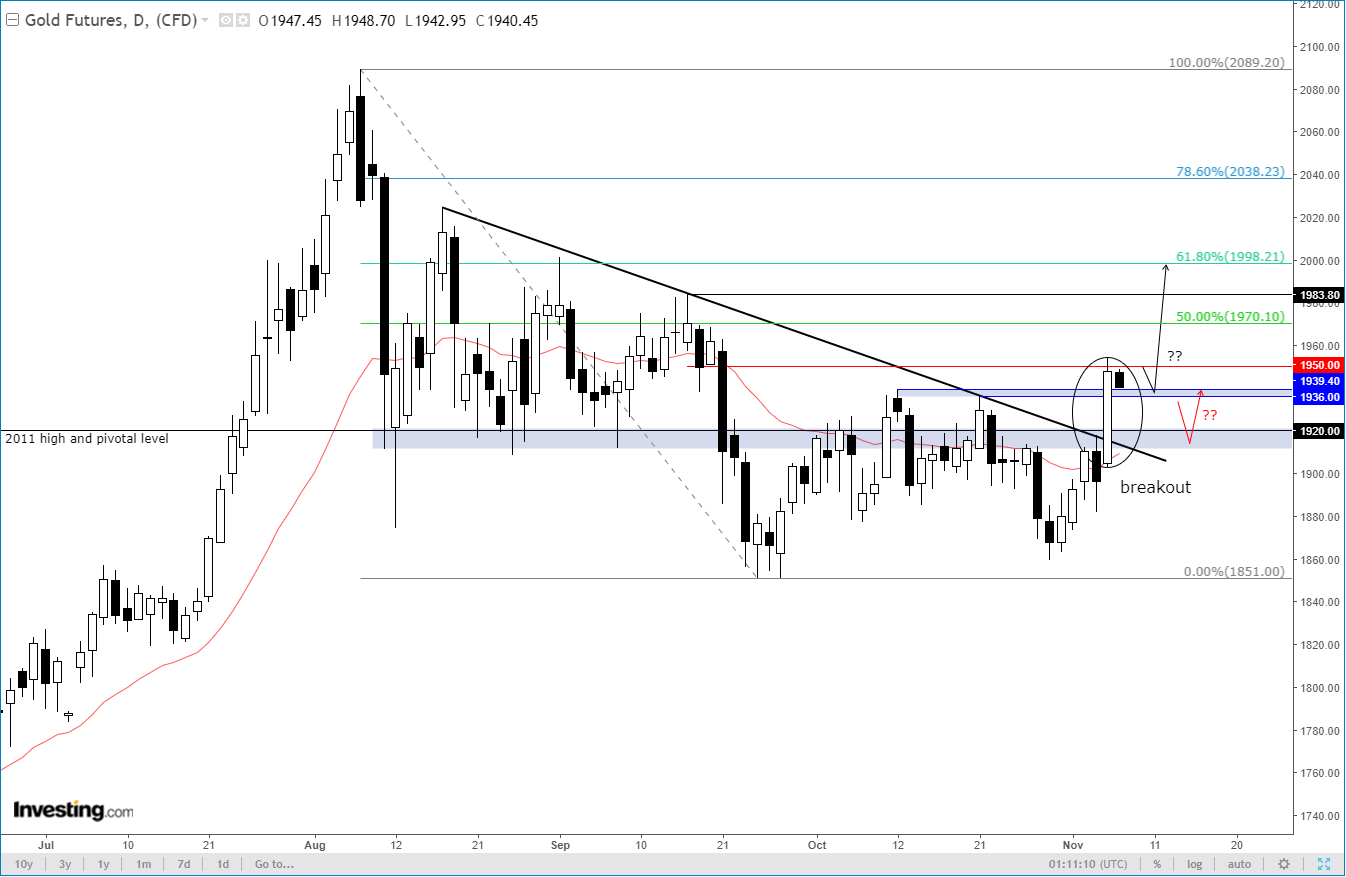
As a result of the rally, gold has finally broken above its bearish trend line:

The breakout has pushed the price of gold above the pivotal level of $1920/1, which was also the 2011 peak. Given these developments alone, you would have to think that this will lead to further technical buying in the days to come.
However, gold started Friday’s session lower, as some investors undoubtedly took profit ahead of the US jobs report. But given the above fundamental and technical considerations, the path of least resistance is now likely to be to the upside again. Consequently, I will be expecting the dips to be defended by the bulls around levels that were previously resistance.
The first such area is between $1936 to $1940, which was being tested at the time of writing in the early hours of Friday. Below this, the next key level is that $1920/1 hurdle, which is now also the base of the breakout.
Given Thursday’s big breakout candle, I would now expect to see a shallow retracement, meaning the first of the above support levels could be defended by the bulls, thus preventing prices to dip to the second support area today.
In any case, if those levels hold as I think they will, then the next targets could be the Fibonacci levels shown on the chart, with the 61.8% retracement against the all-time high being an important technical level since it comes in around the psychologically-important $2000 level.
Without getting too carried away by the technical breakout, it is worth pointing out that the length of time gold has spent in consolidation over the past few months is strongly suggesting that the next move could potentially be explosive.
Gold bears had many opportunities to drive prices lower and their attempts have proven to be futile so far. The metal’s resilience means the buyers have remained in overall control despite the multi-month consolidation.
Now that prices are no longer technically overbought (on the higher time frames) and given the above fundamental and technical factors, I wouldn’t be surprised if we saw a new record high soon.
